Data Analysis
Visual insights derived from the historical Bangladesh energy dataset (2020-2024).
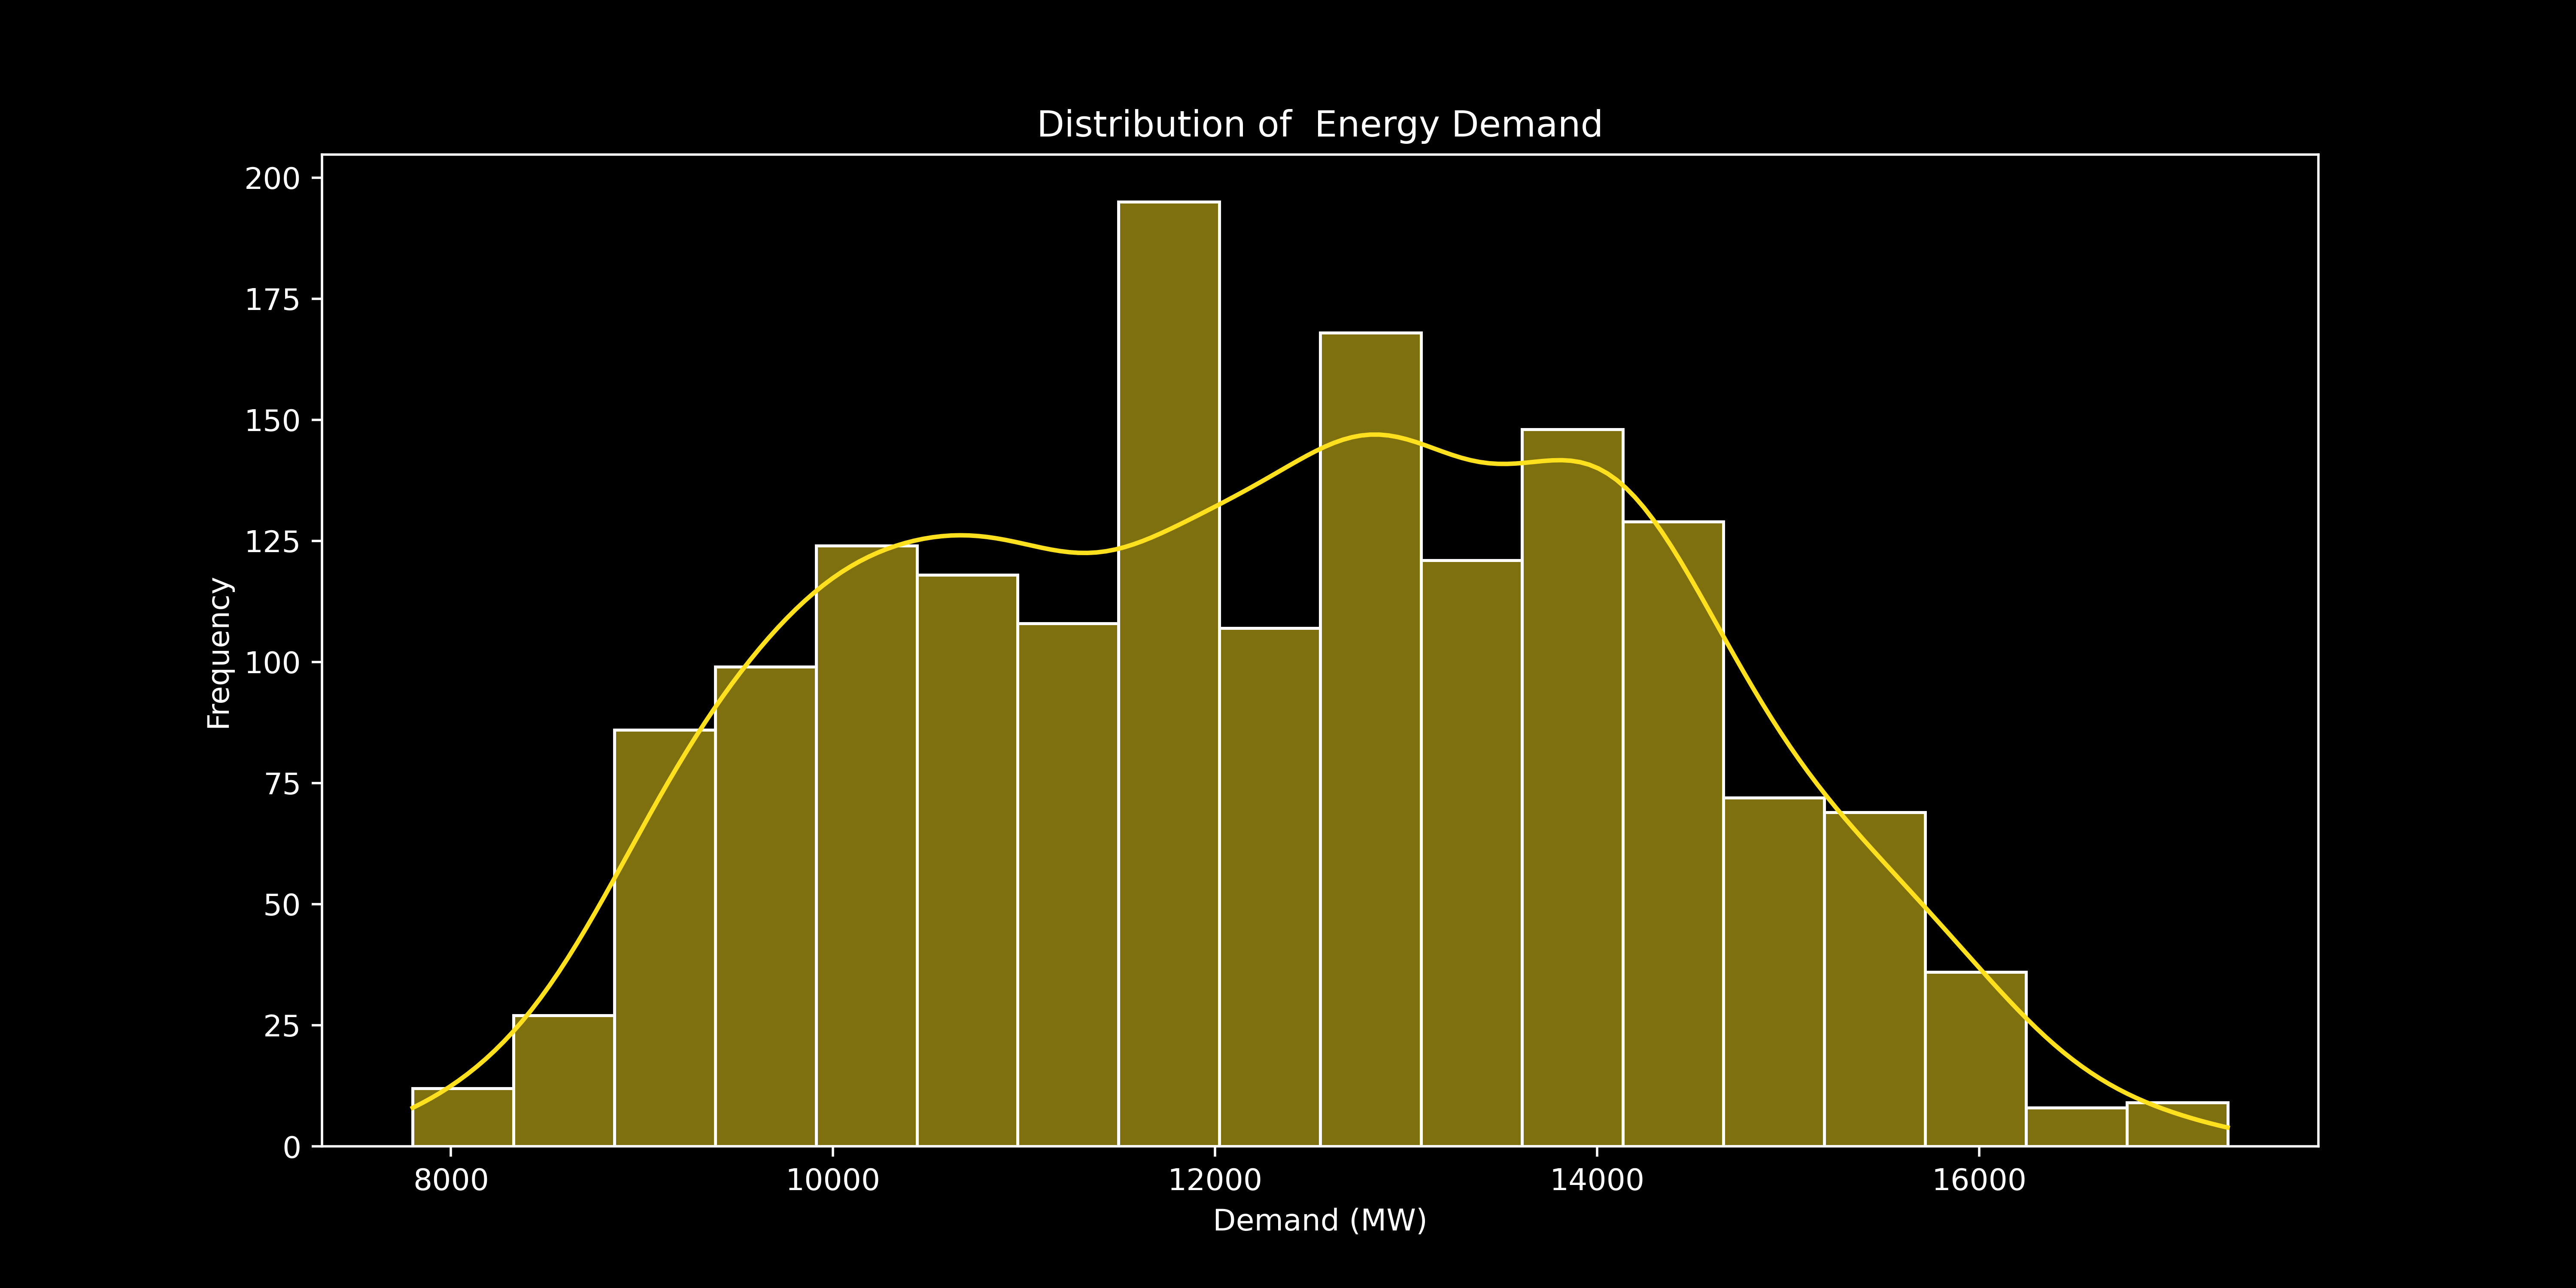
Demand Distribution
Shows a spread-out distribution, slightly right-skewed. Most frequent demand is around 12,000–14,000 MW.
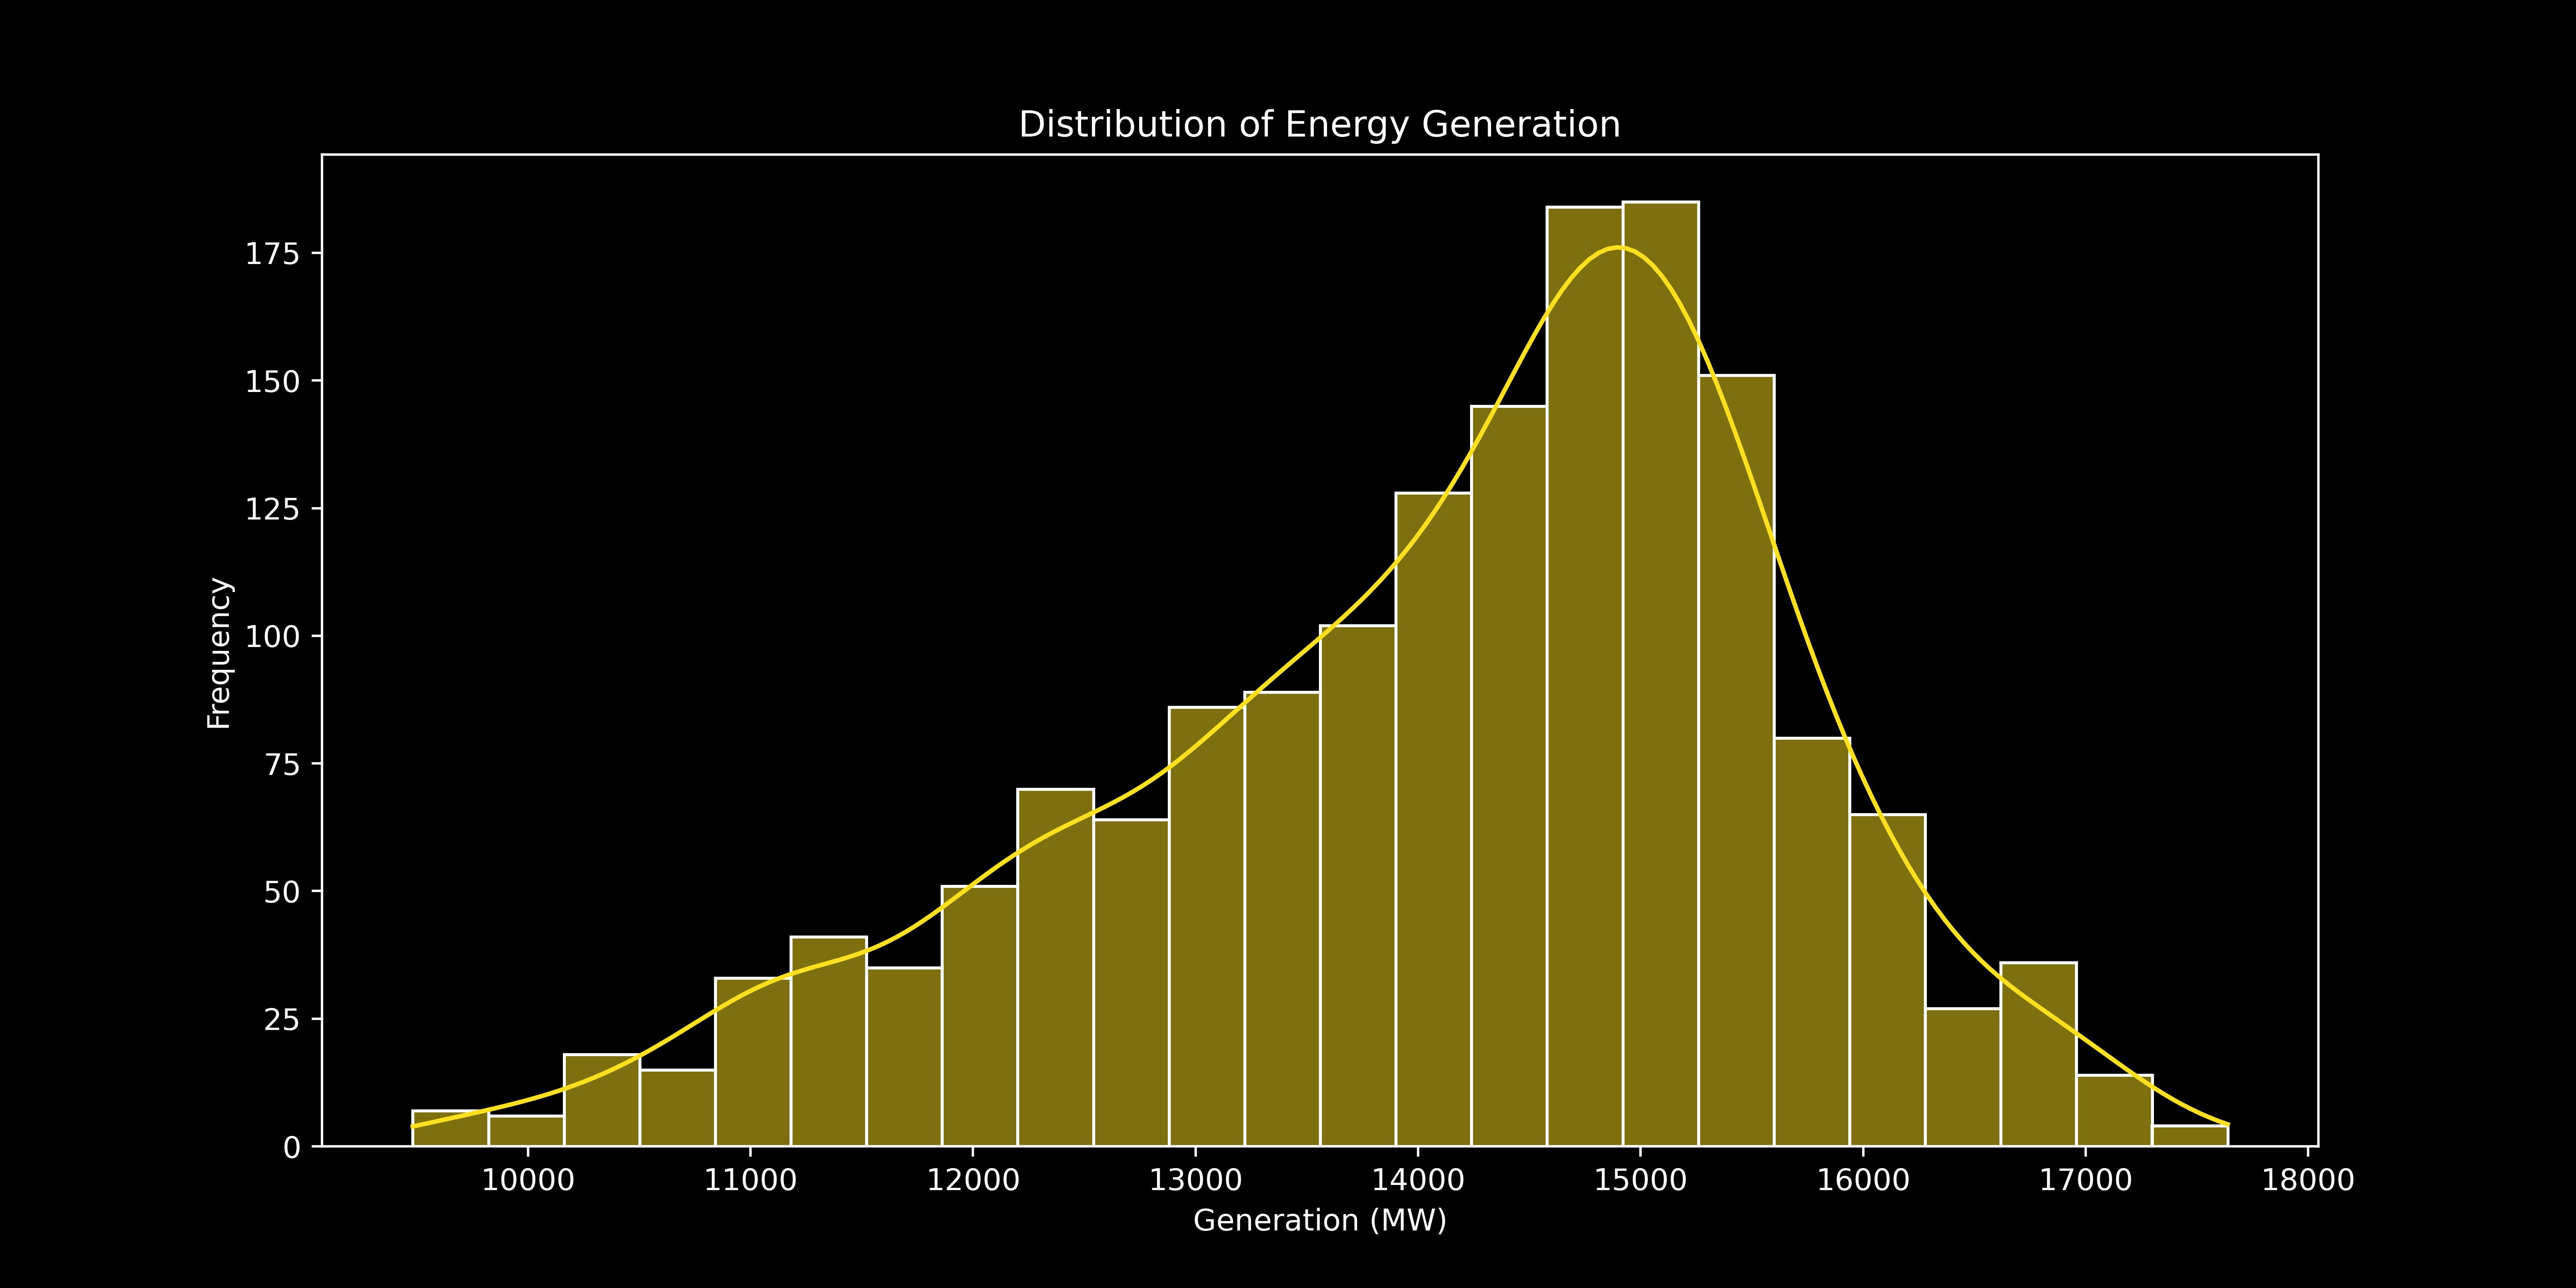
Generation Distribution
Clearly skewed right, indicating higher generation levels are more common. The most frequent value is near 15,000 MW.
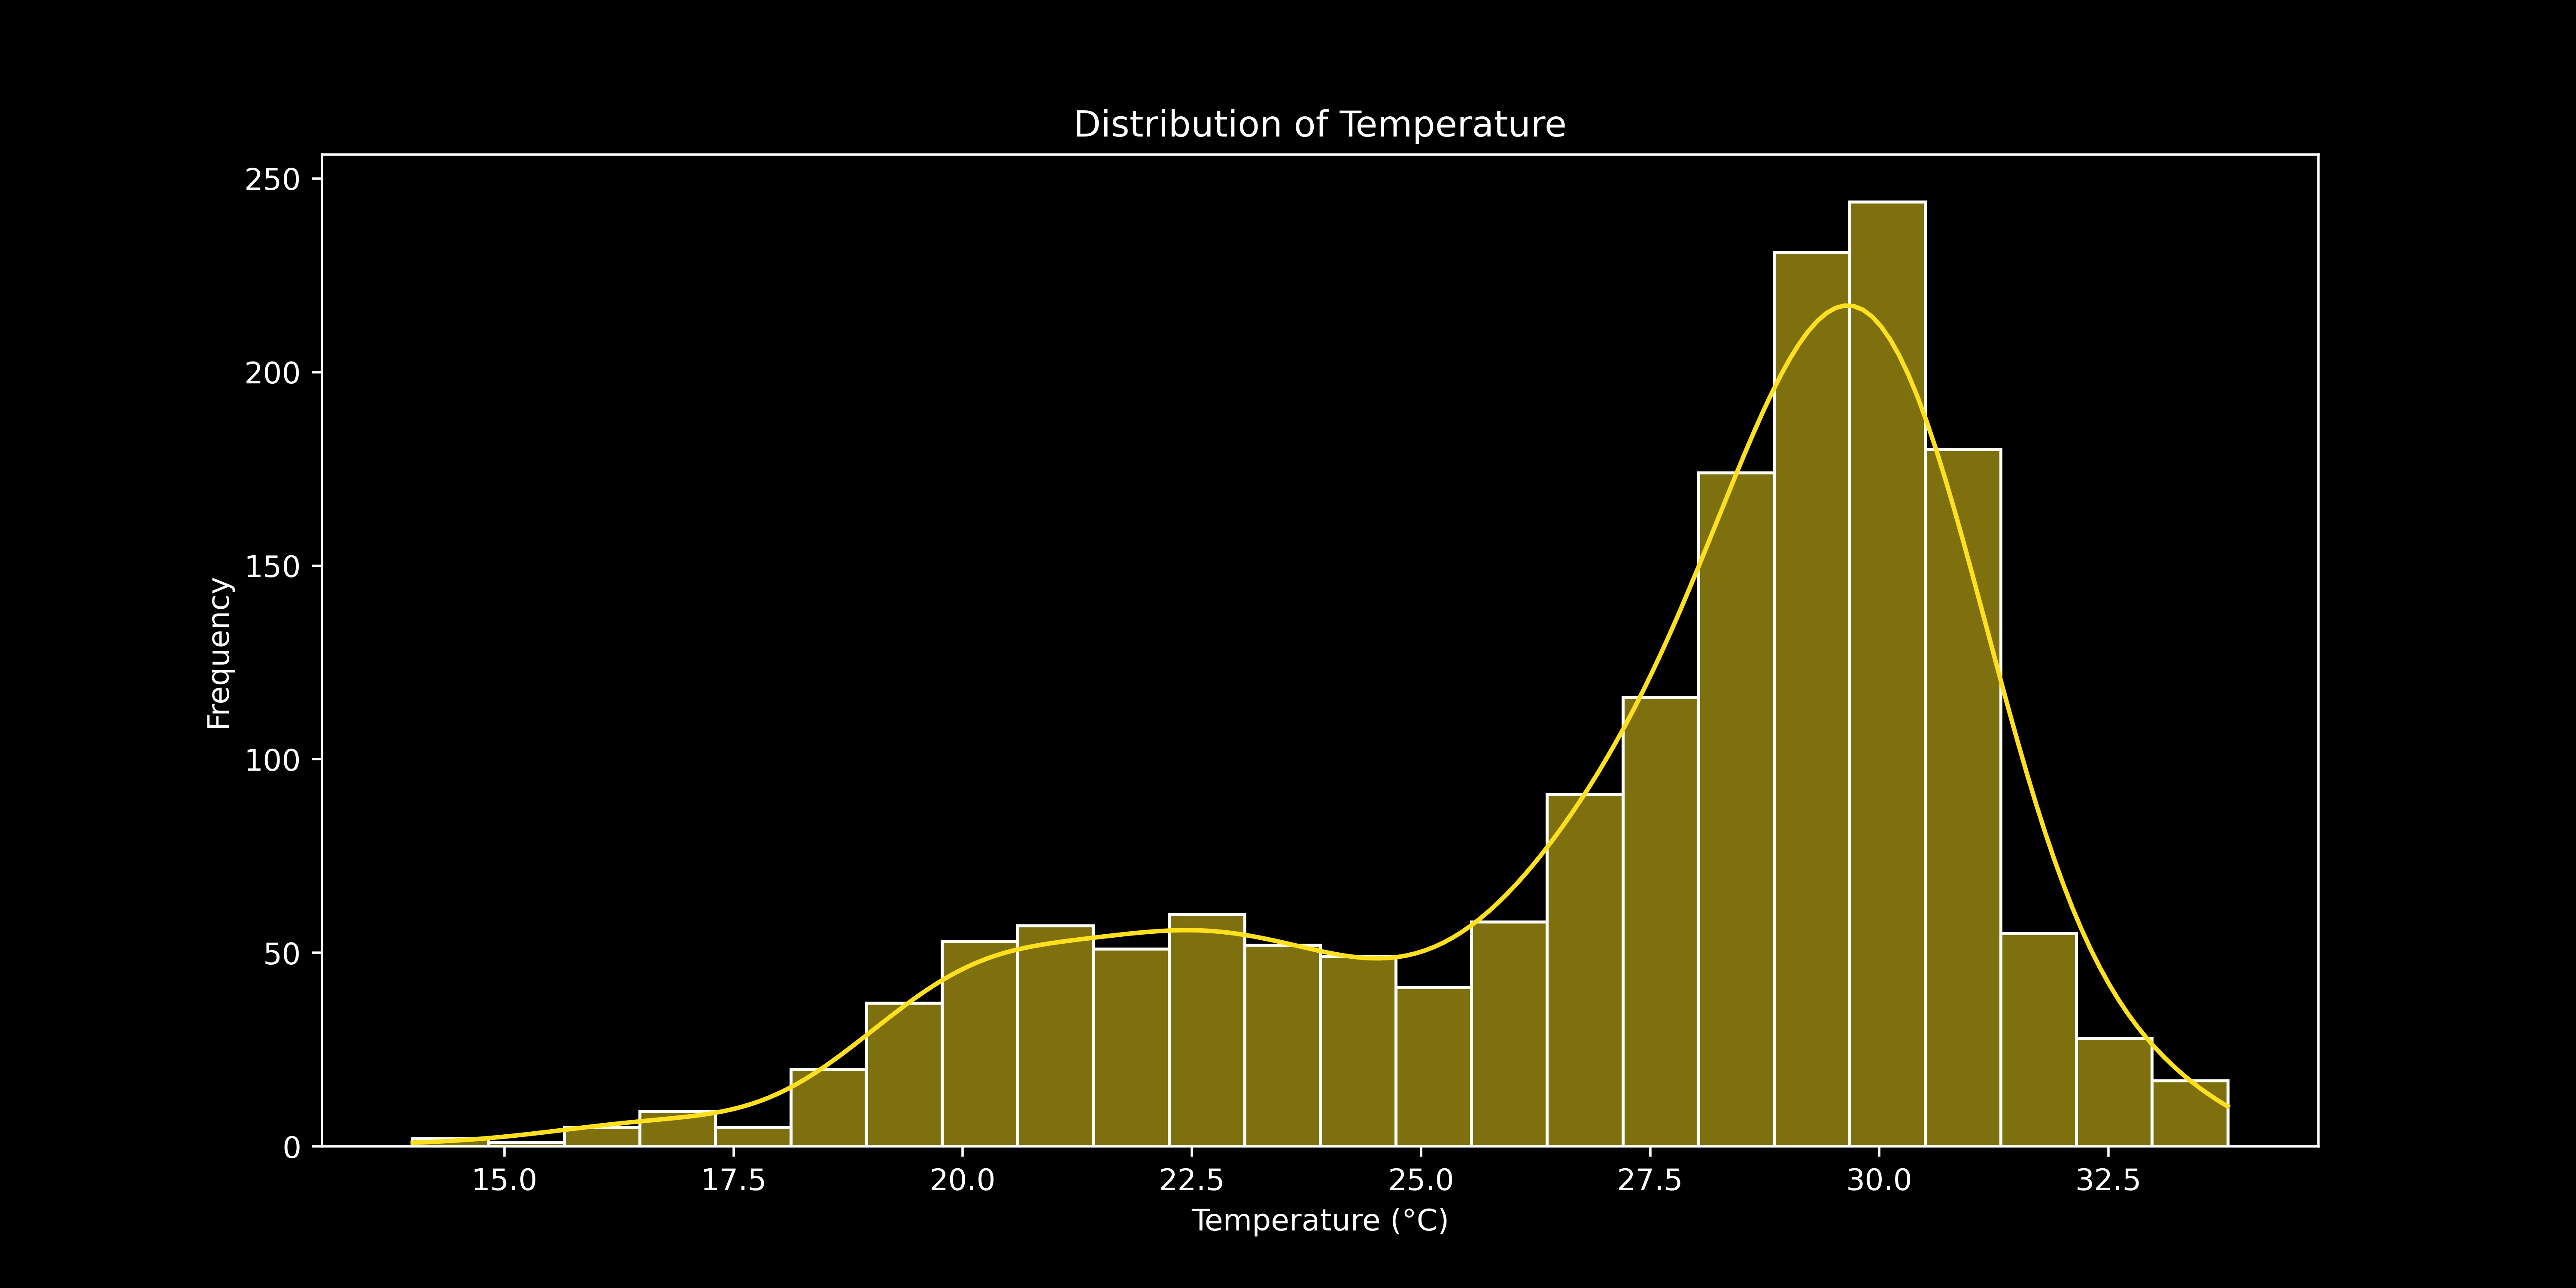
Temperature Distribution
Most frequent temperature range observed is ~28°C to 31°C, typical for Bangladesh's climate.
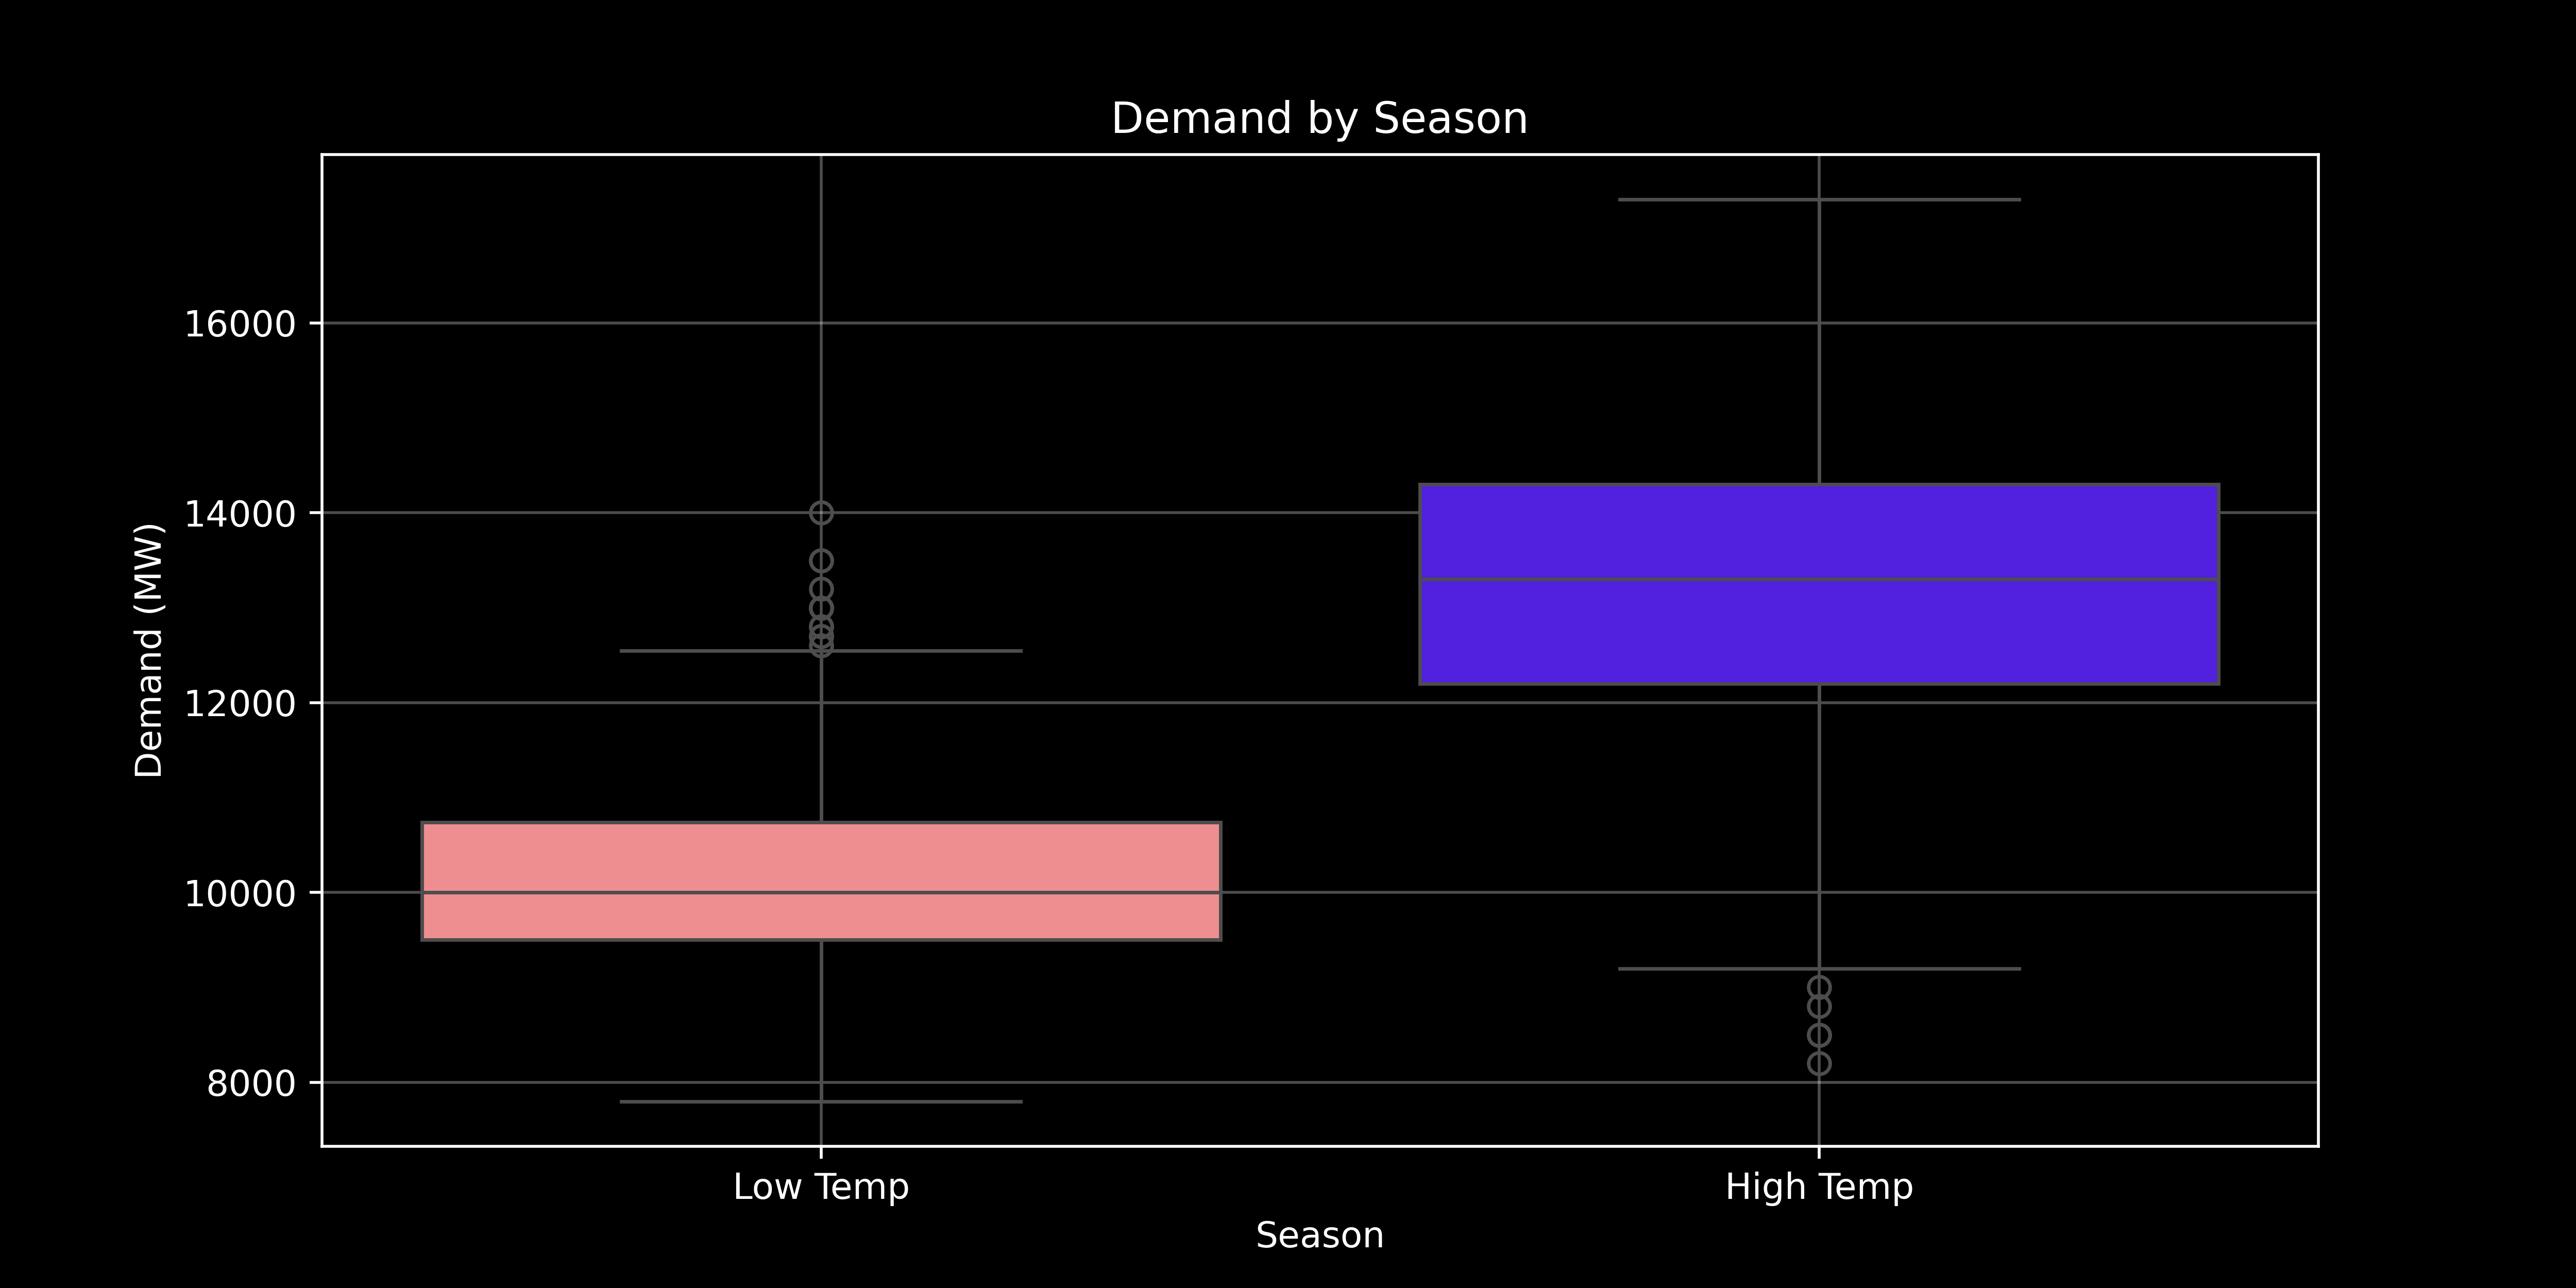
Seasonal Demand Impact
Average energy demand is significantly lower in Low Temperature Seasons (~10k MW) compared to High Temperature Seasons (~13k MW).
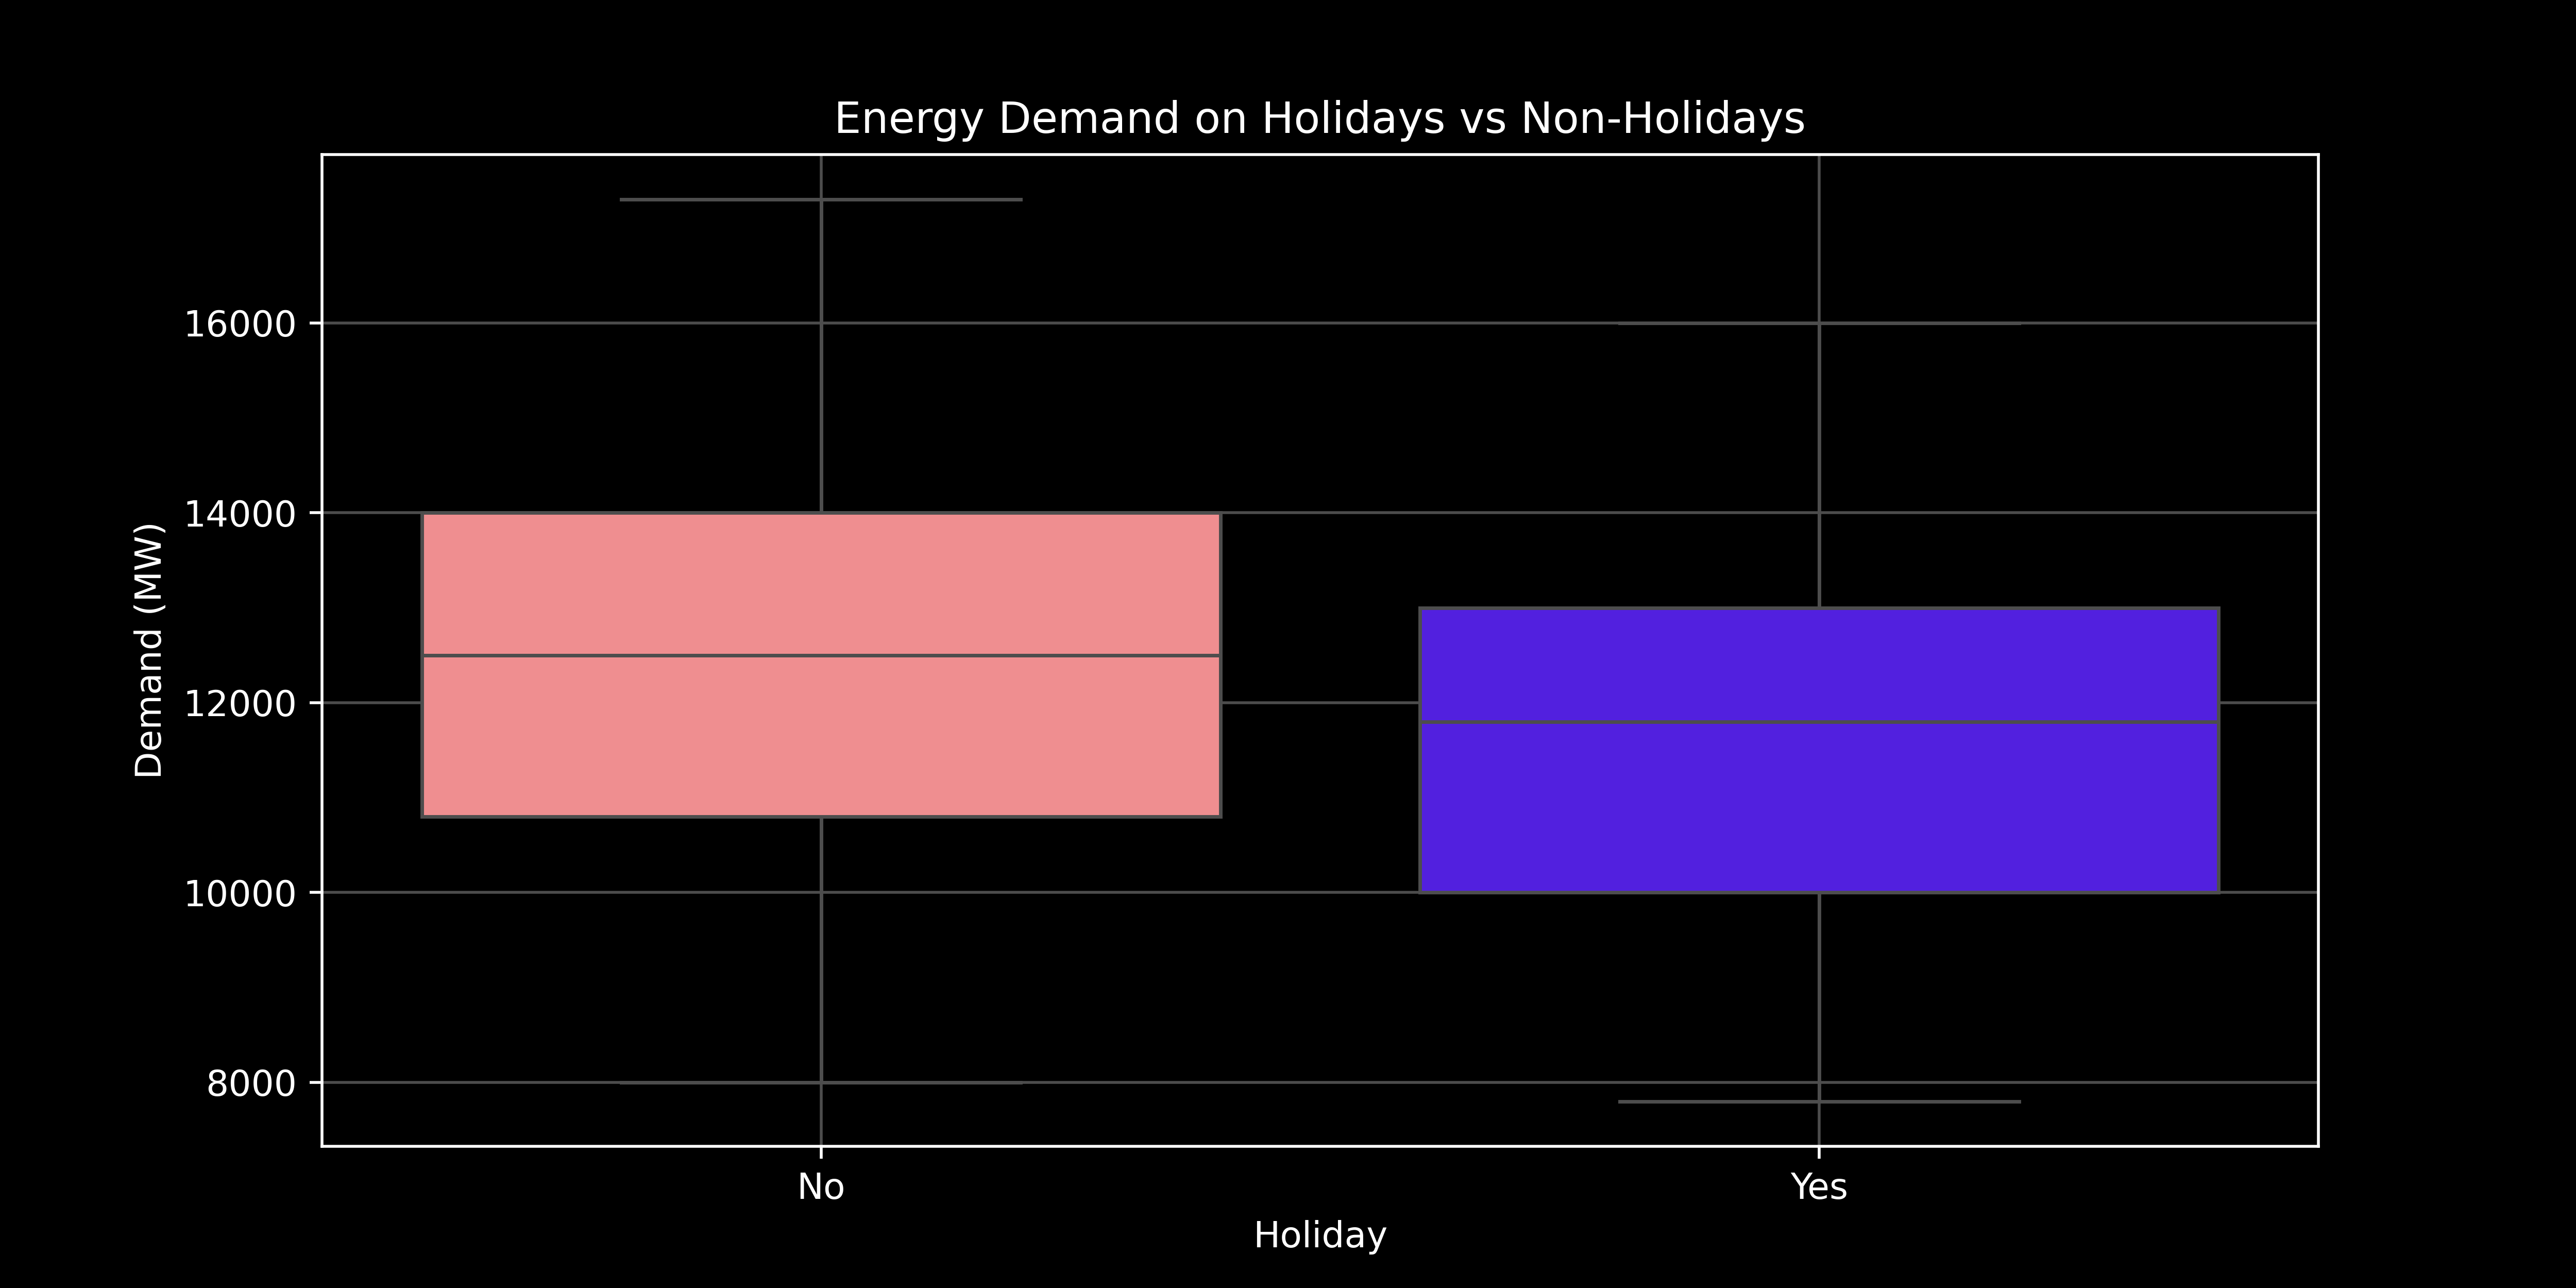
Holiday Demand Impact
Counter-intuitively, average demand is lower on holidays, likely due to reduced industrial activity and holiday timing during cooler seasons.
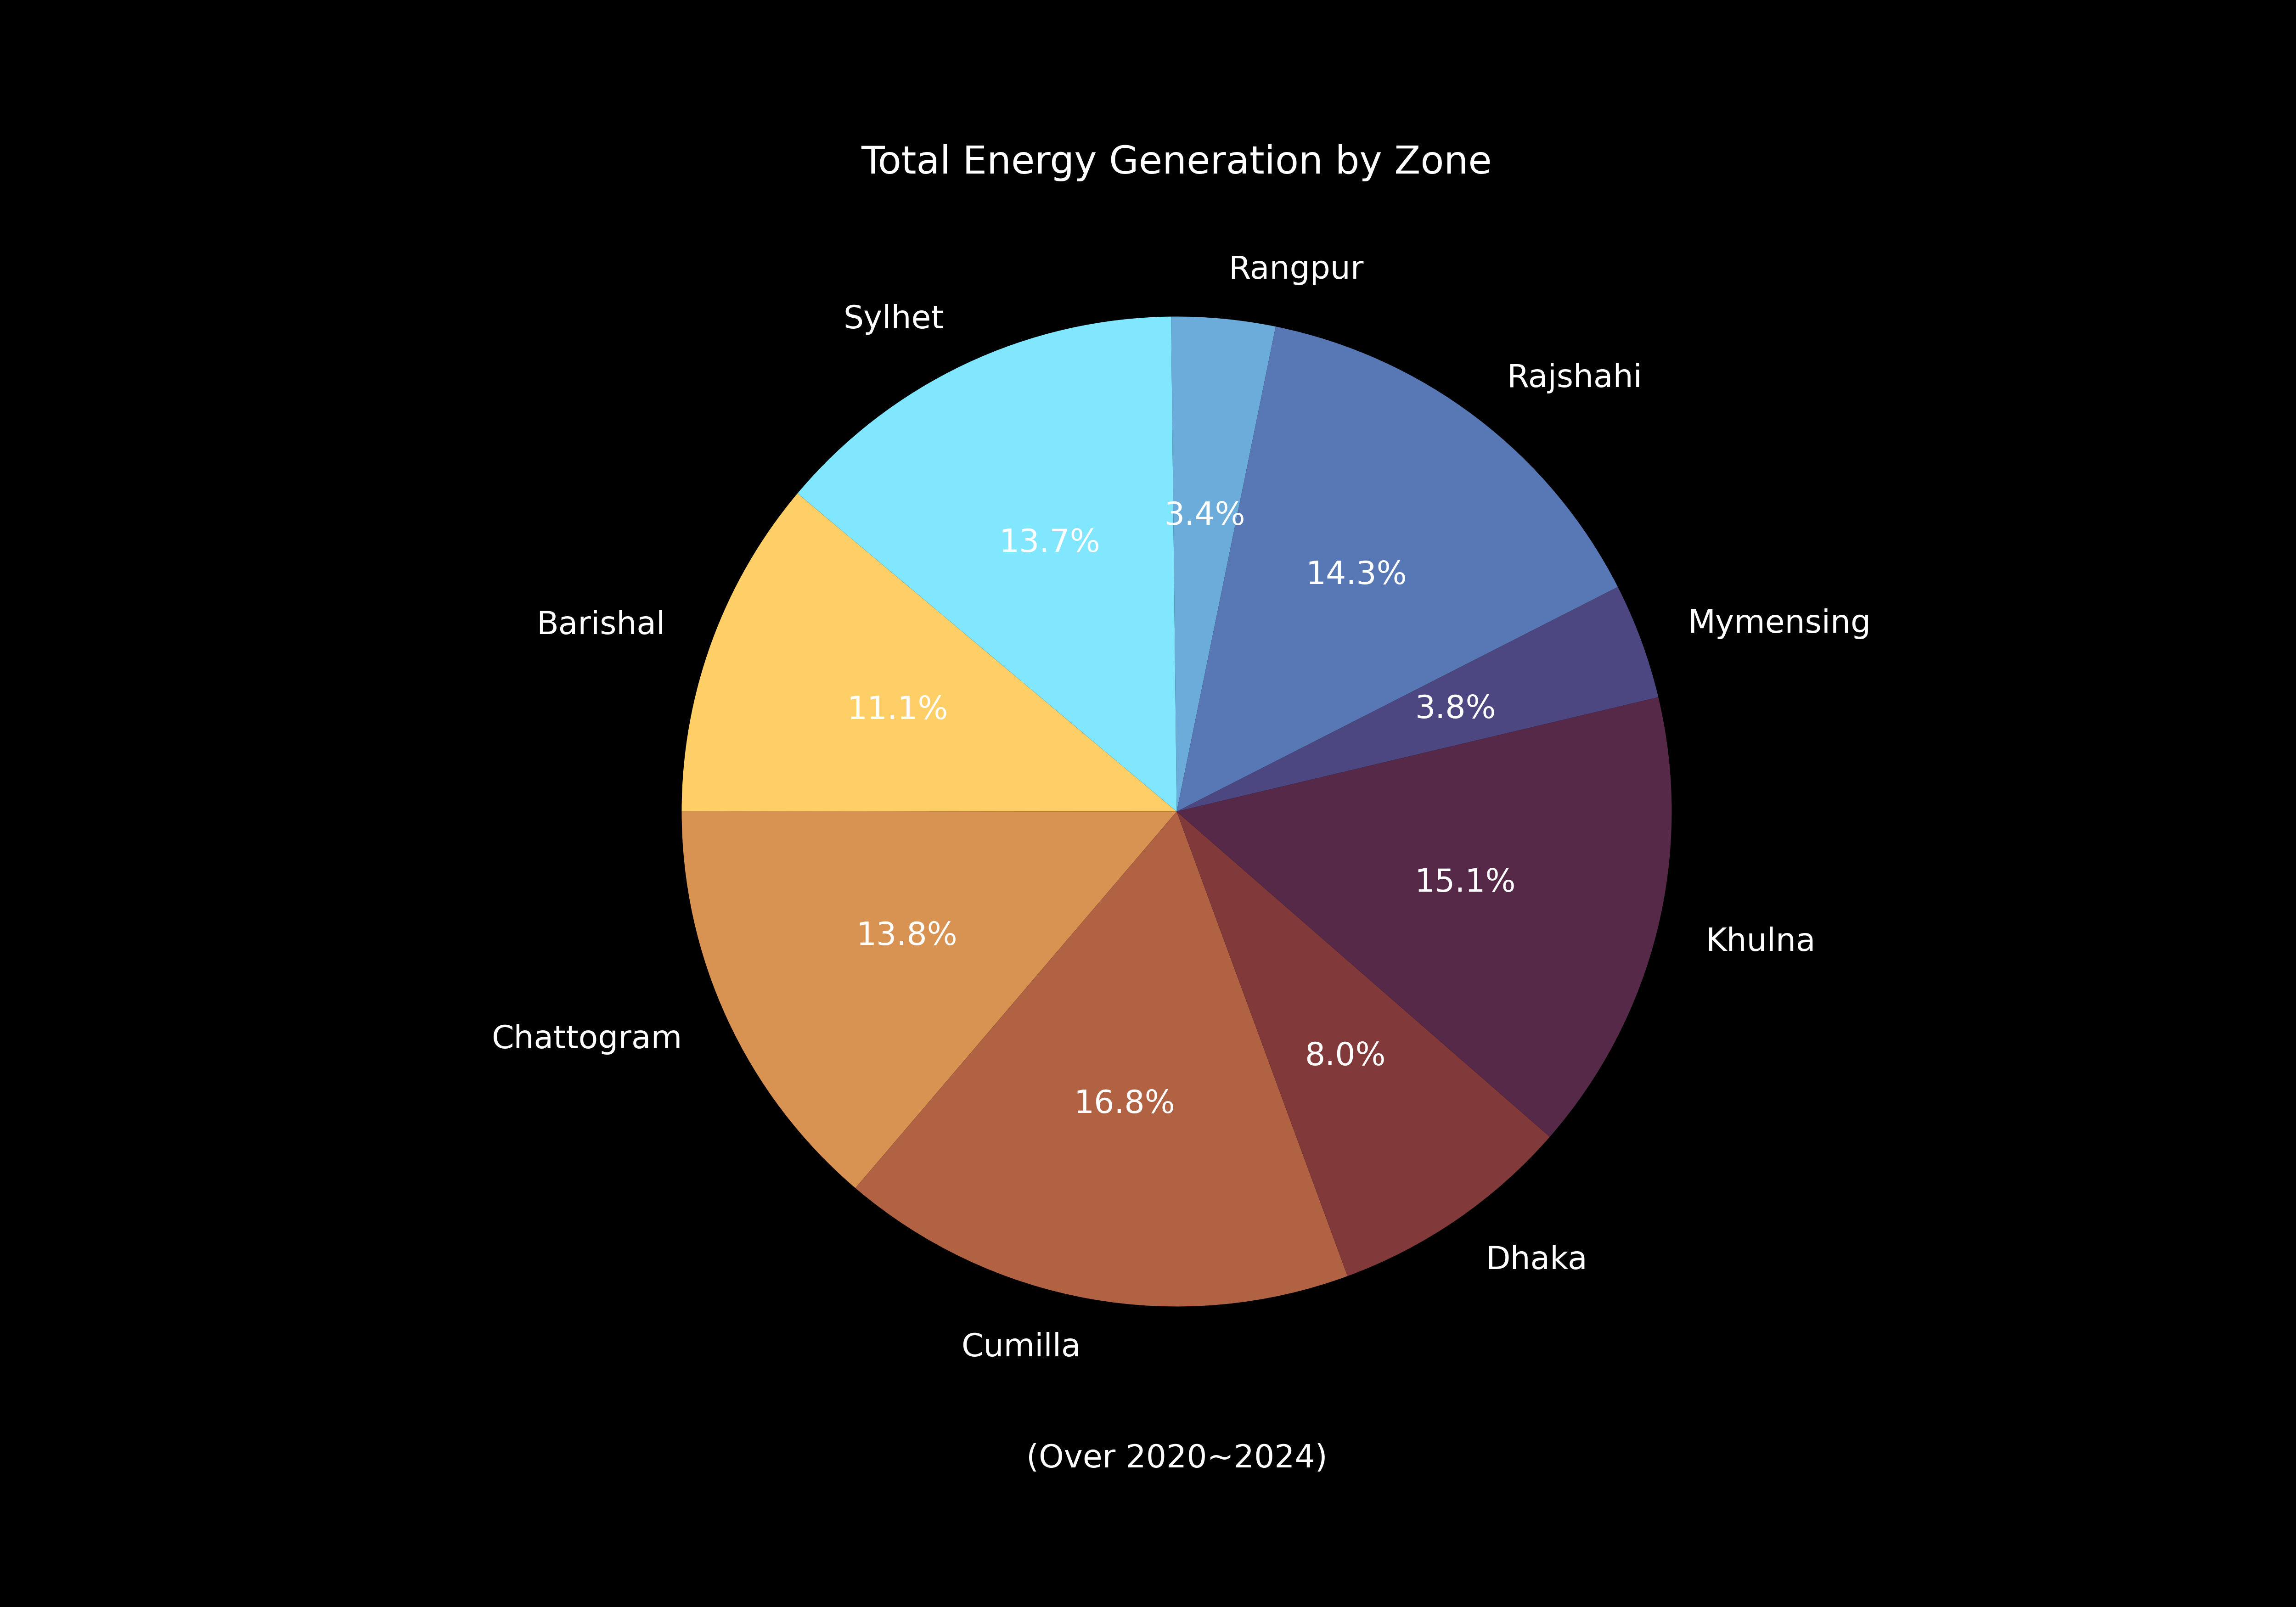
Regional Generation Share
Highlights major energy-generating zones like Cumilla, Khulna, Rajshahi. Dhaka shows relatively lower generation despite population density.
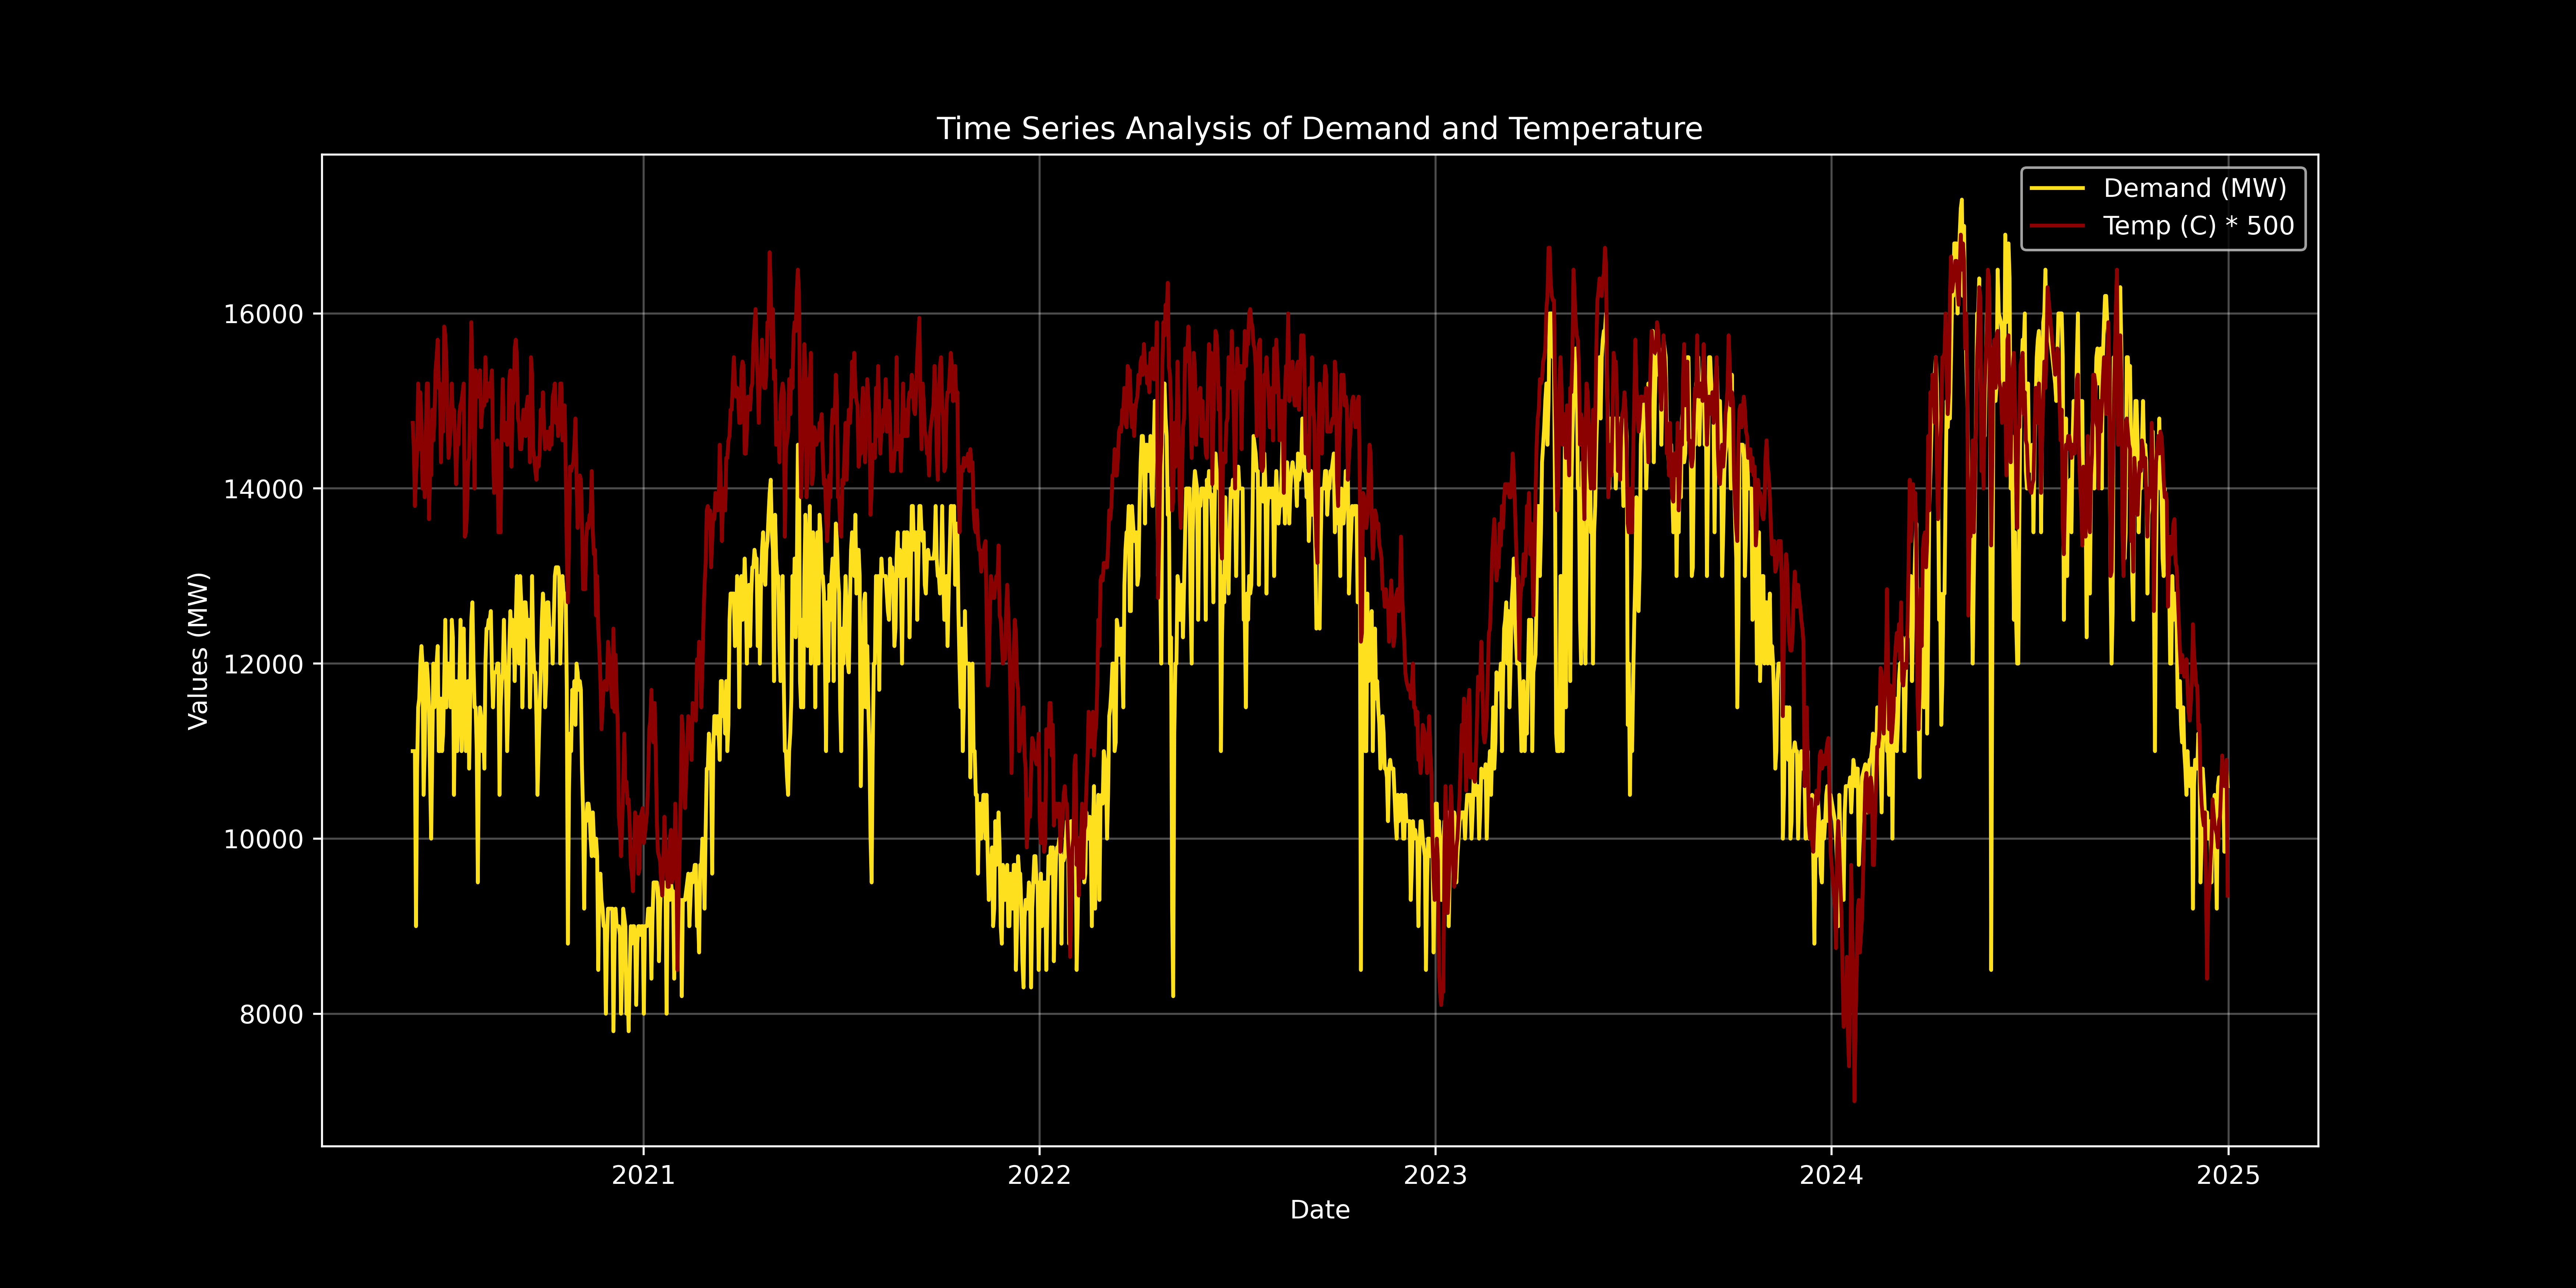
Demand & Temp Over Time
Strong positive correlation shown over time. Both follow similar annual cycles, peaking in warmer months.
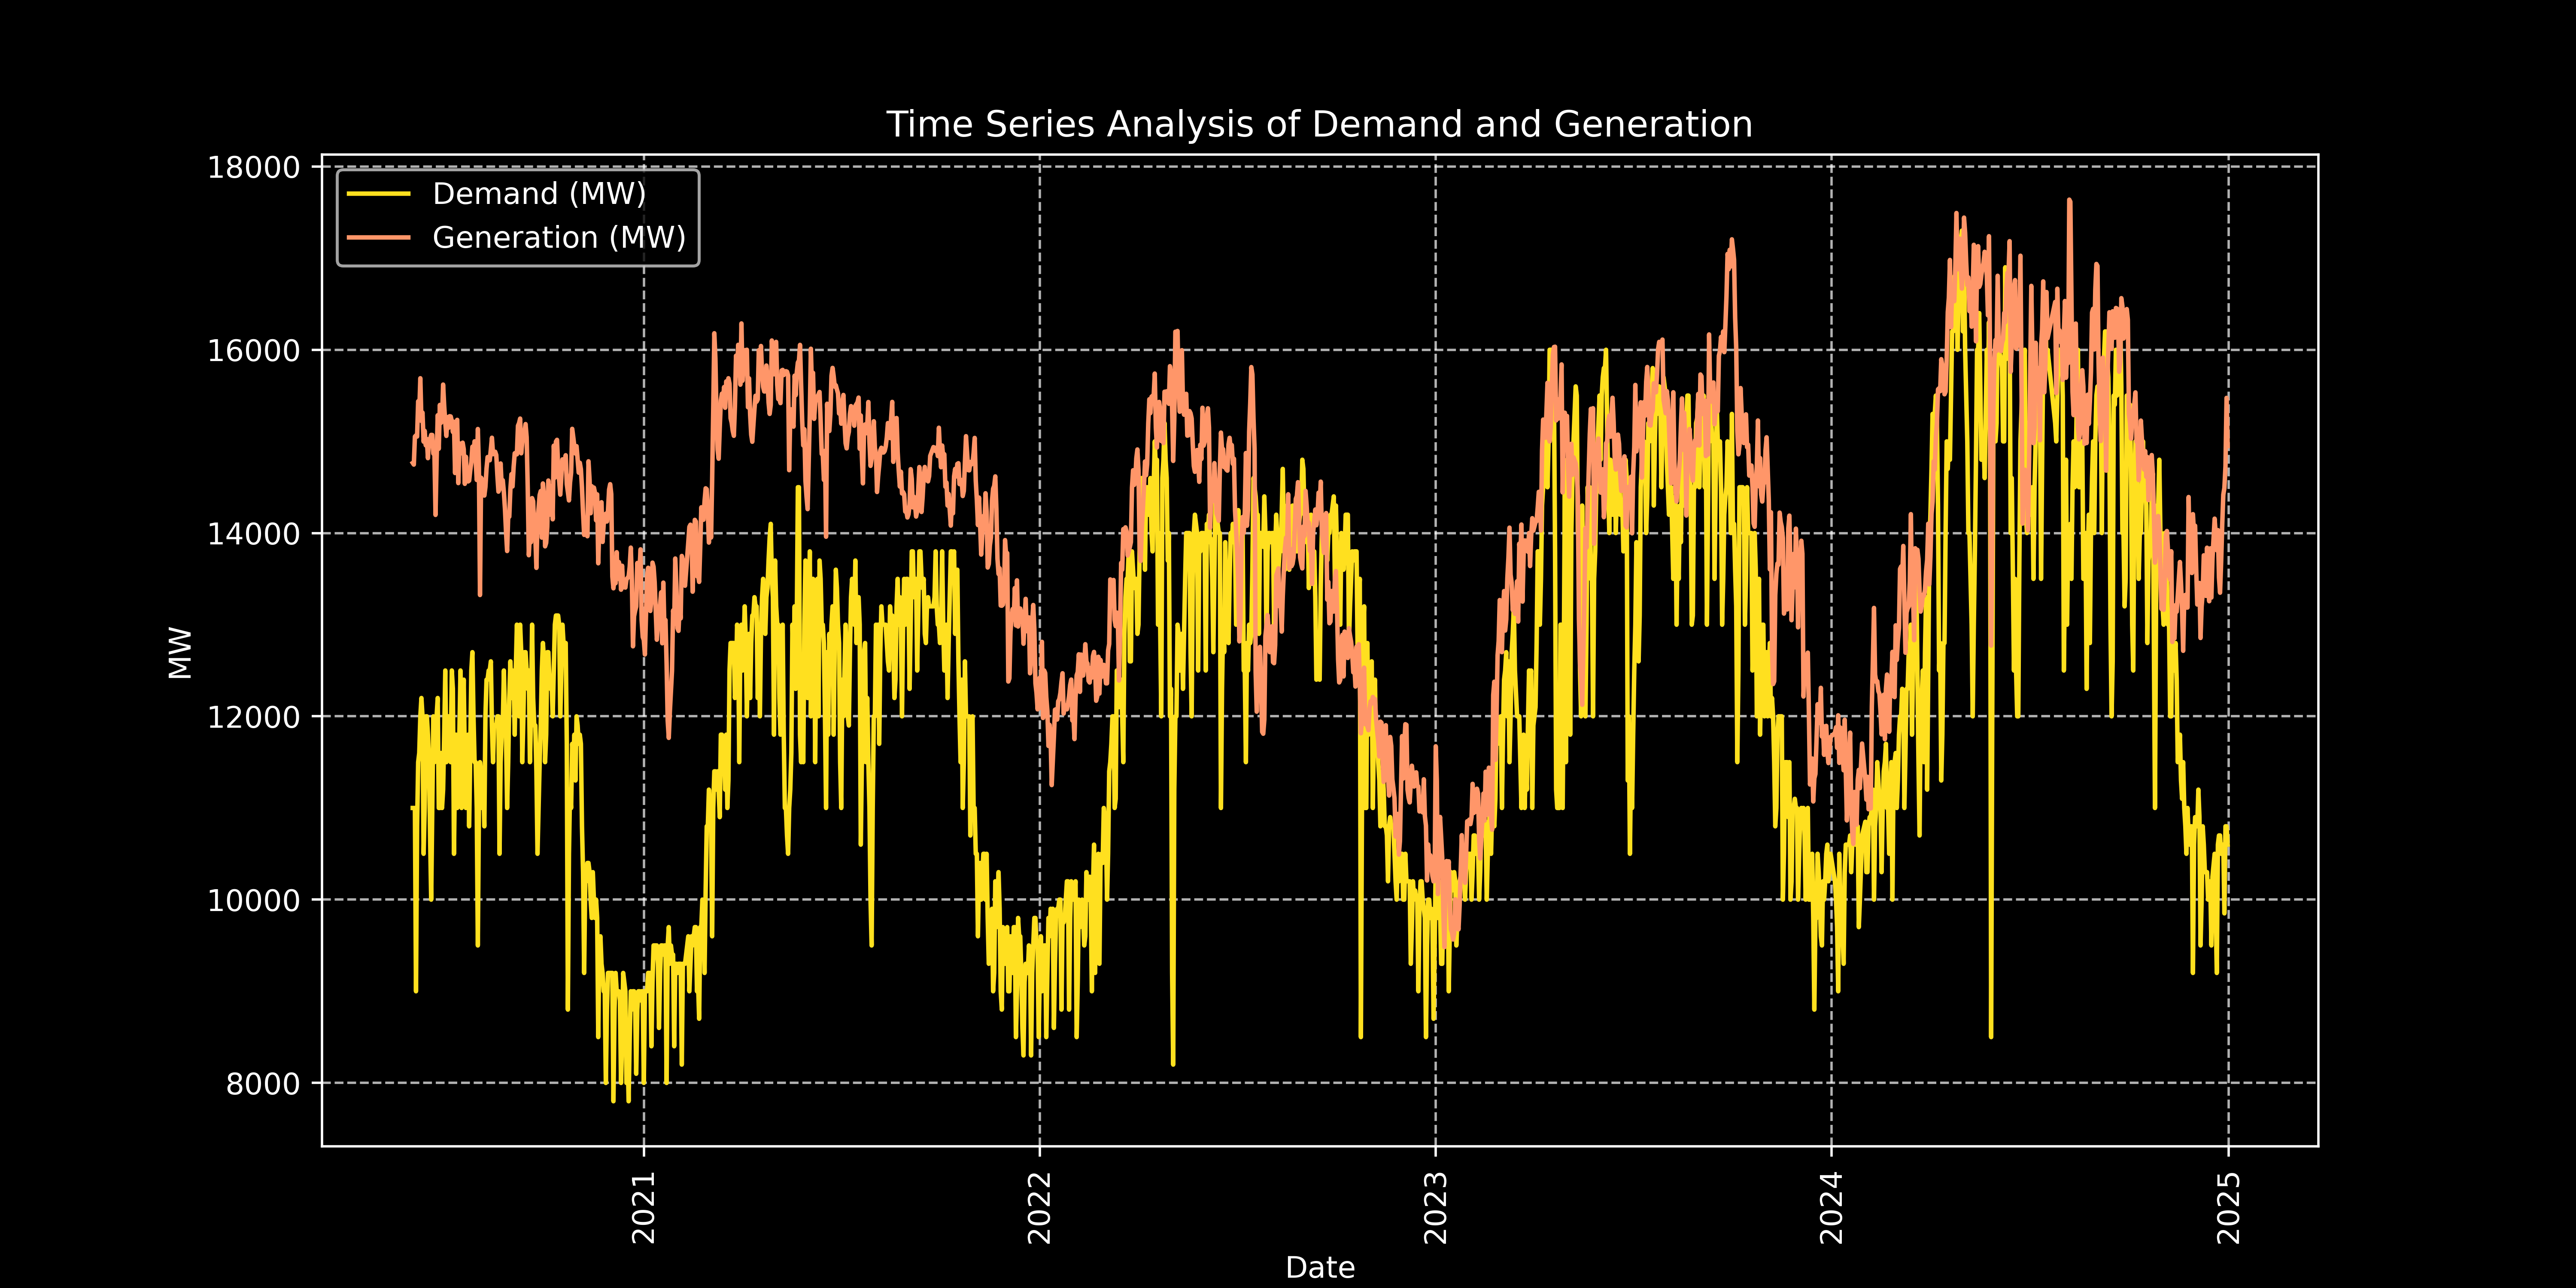
Demand-Generation Gap Trend
Gap narrowed post-2022, but frequent dips below zero indicate persistent optimization challenges and potential load shedding.
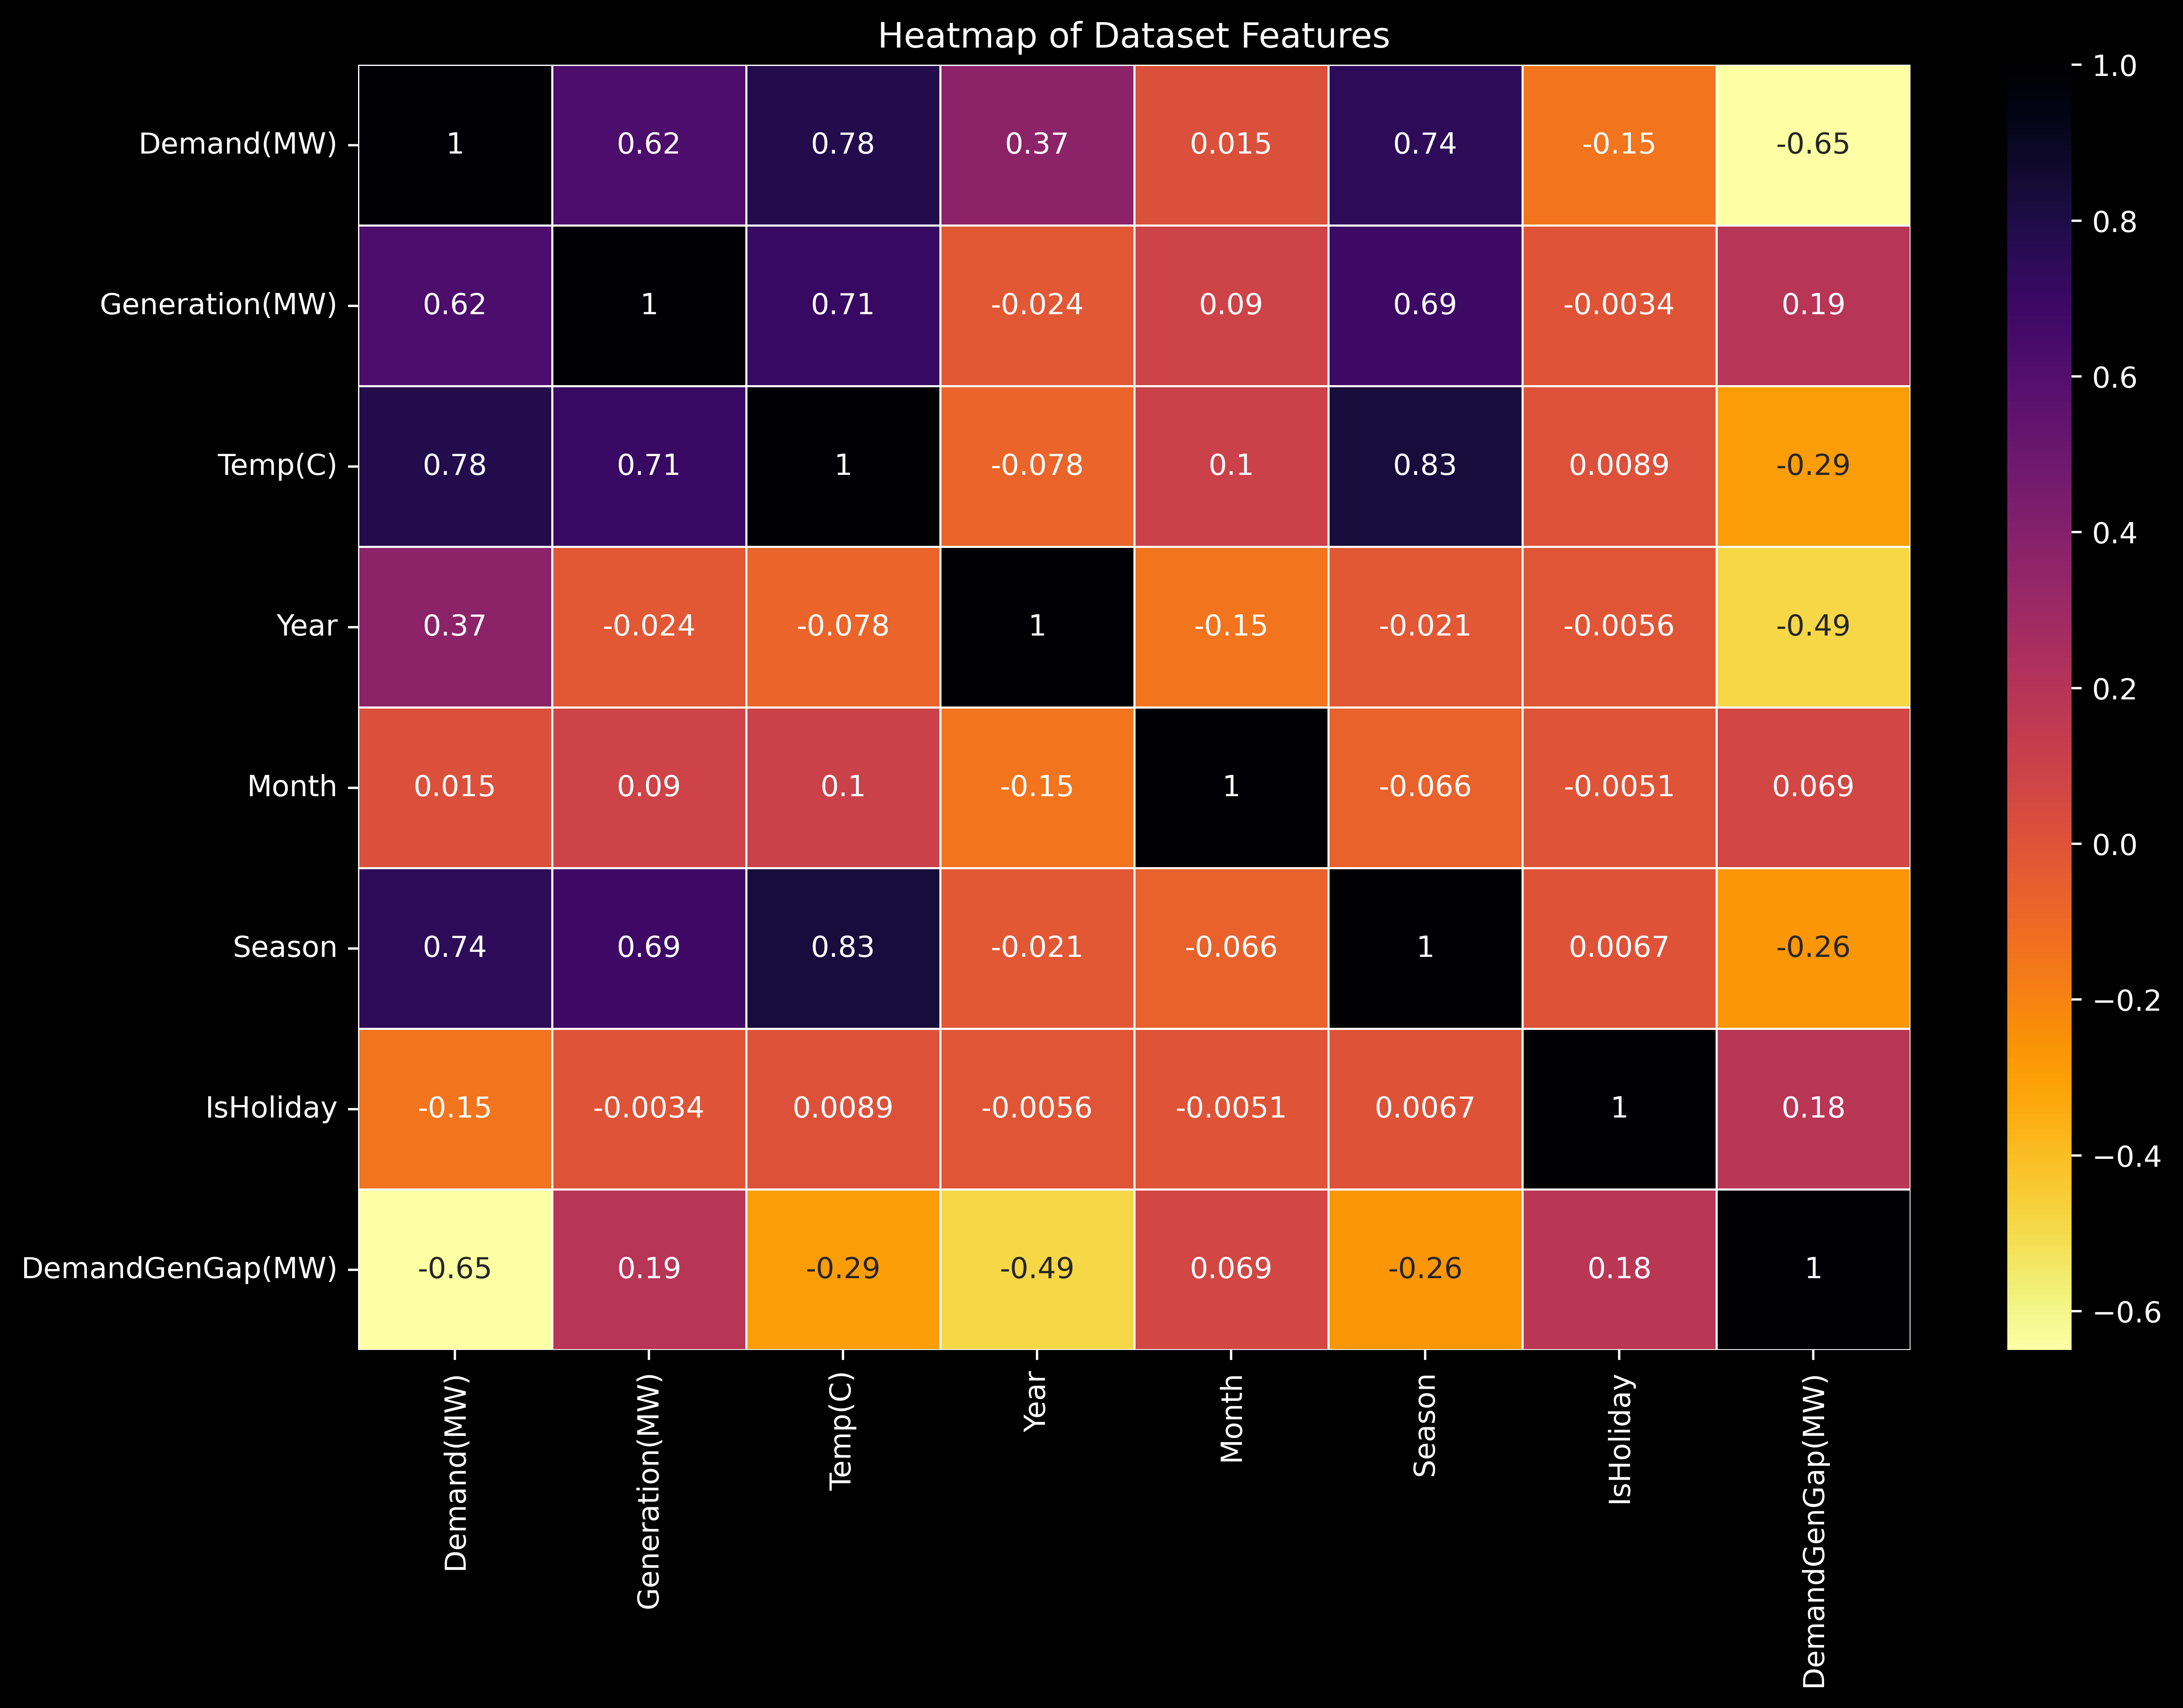
Feature Correlation
Visualizes correlations. Strong positive links: Temp/Demand (0.78), Temp/Generation (0.71). Negative link: Demand/Gap (-0.65).
Model Performance Snapshots
Visual comparison of actual vs. predicted energy demand for selected models.
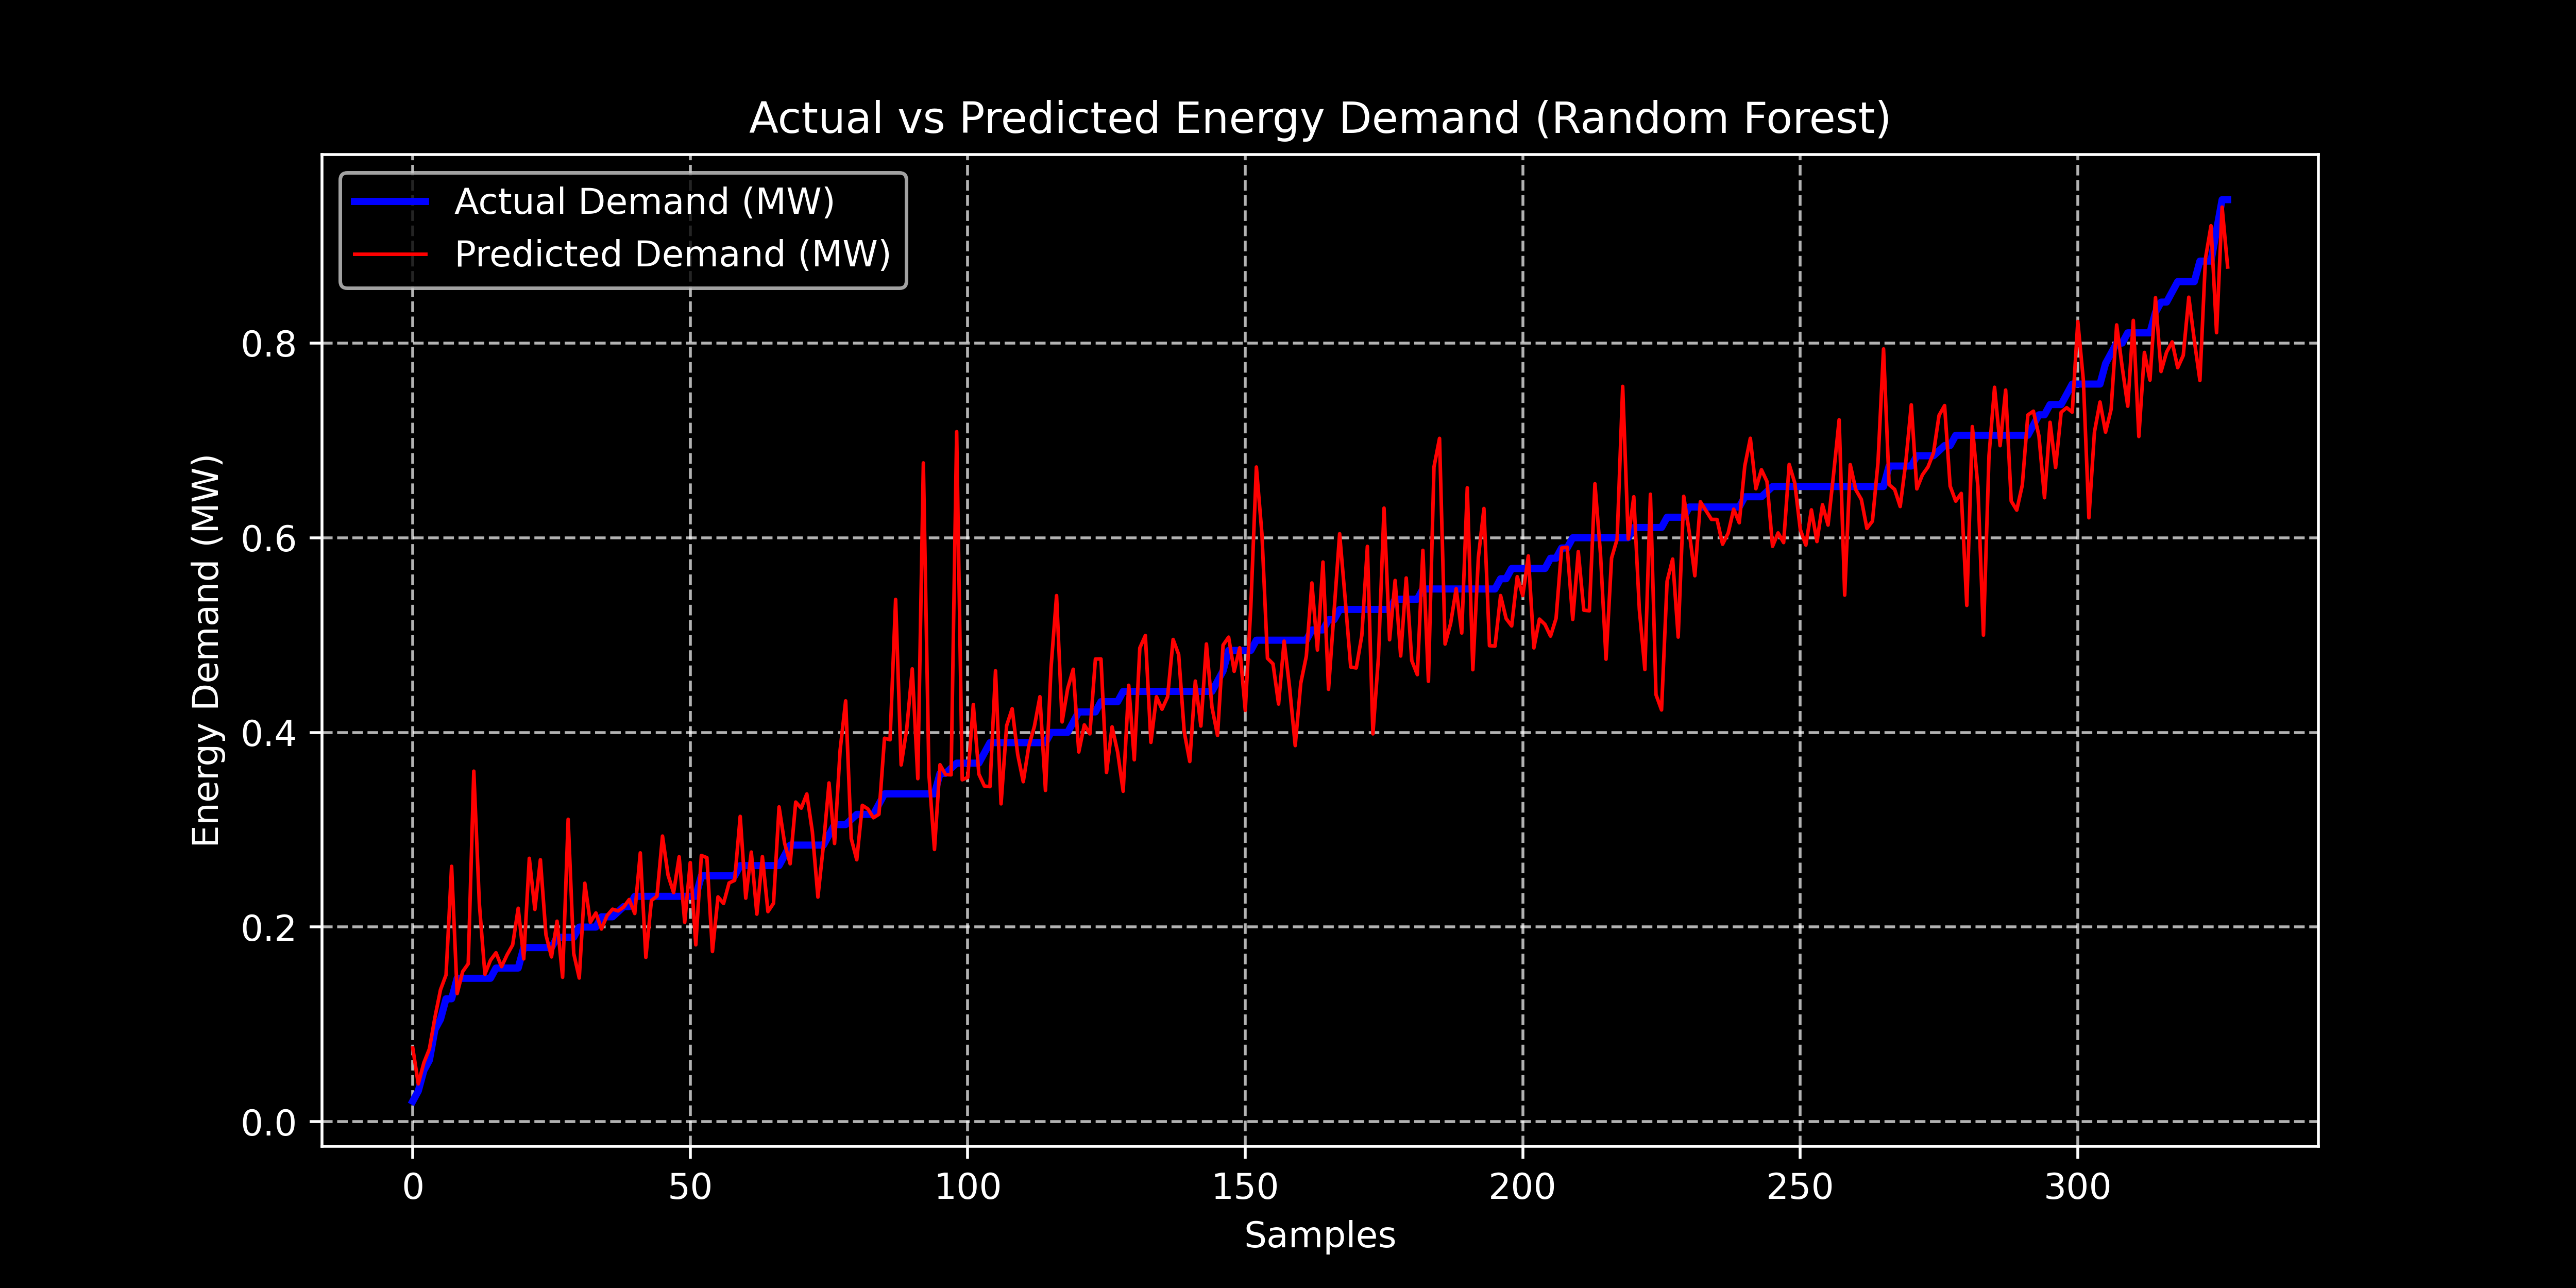
Random Forest Prediction
Shows actual vs. predicted demand using the Random Forest model. Achieved high R2 (~0.90) and low errors in initial tests.
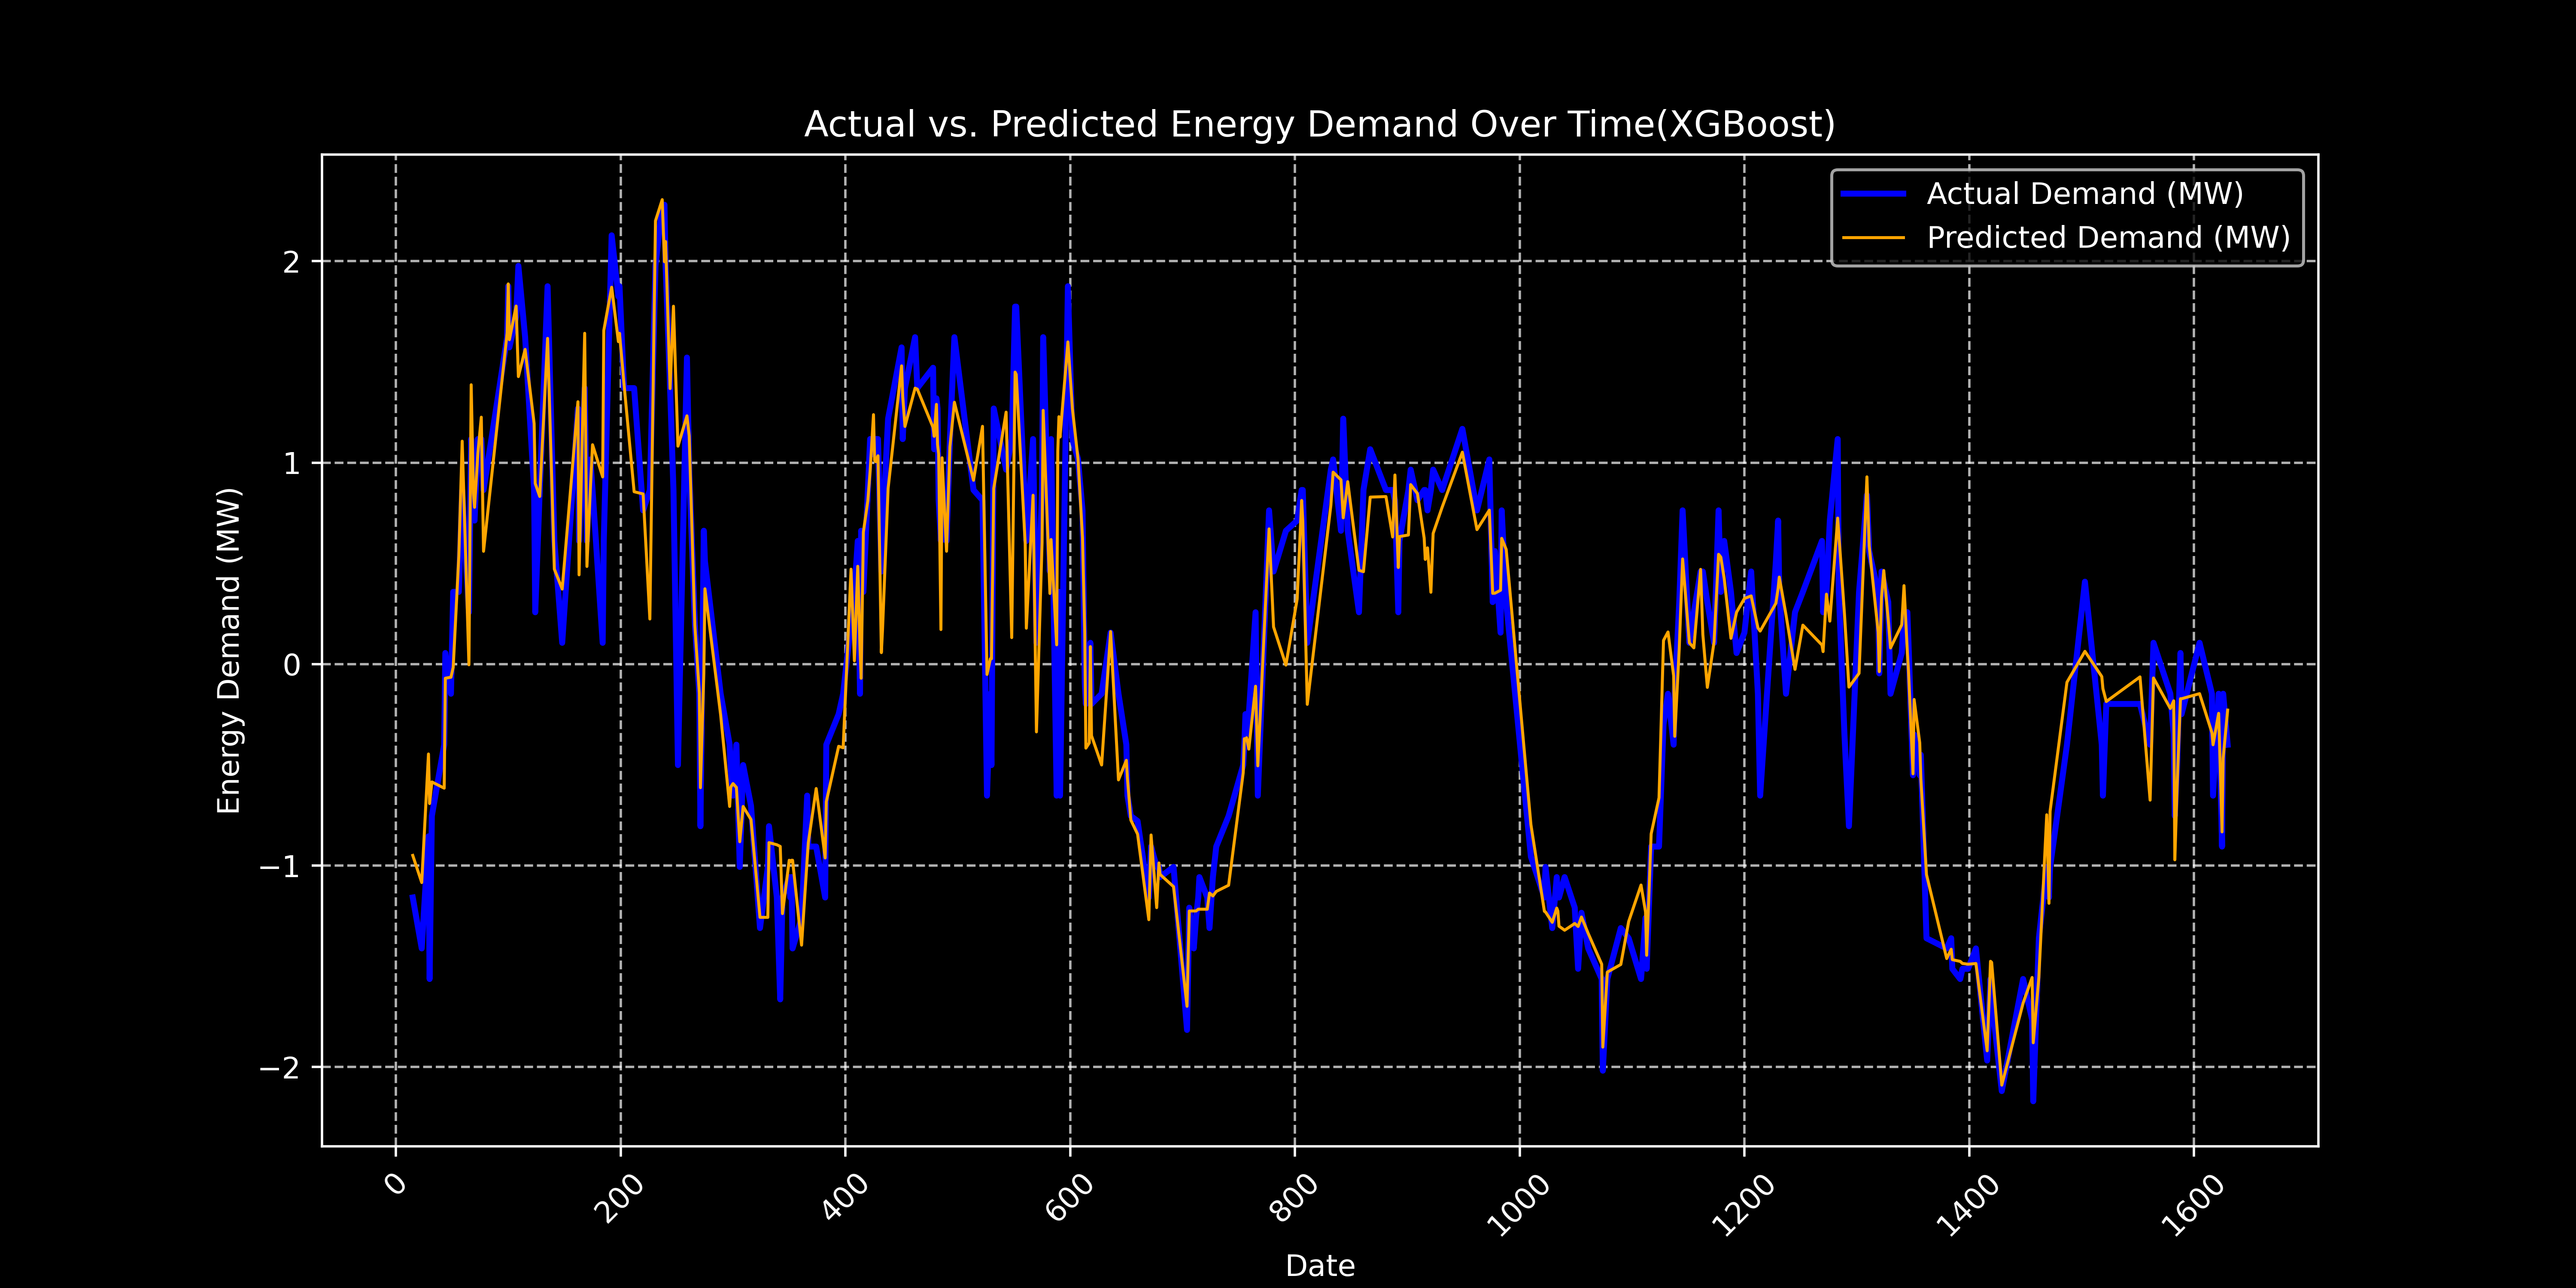
XGBoost Prediction
Actual vs. predicted demand over time using XGBoost. Also performed strongly with R2 ~0.90 and low errors.
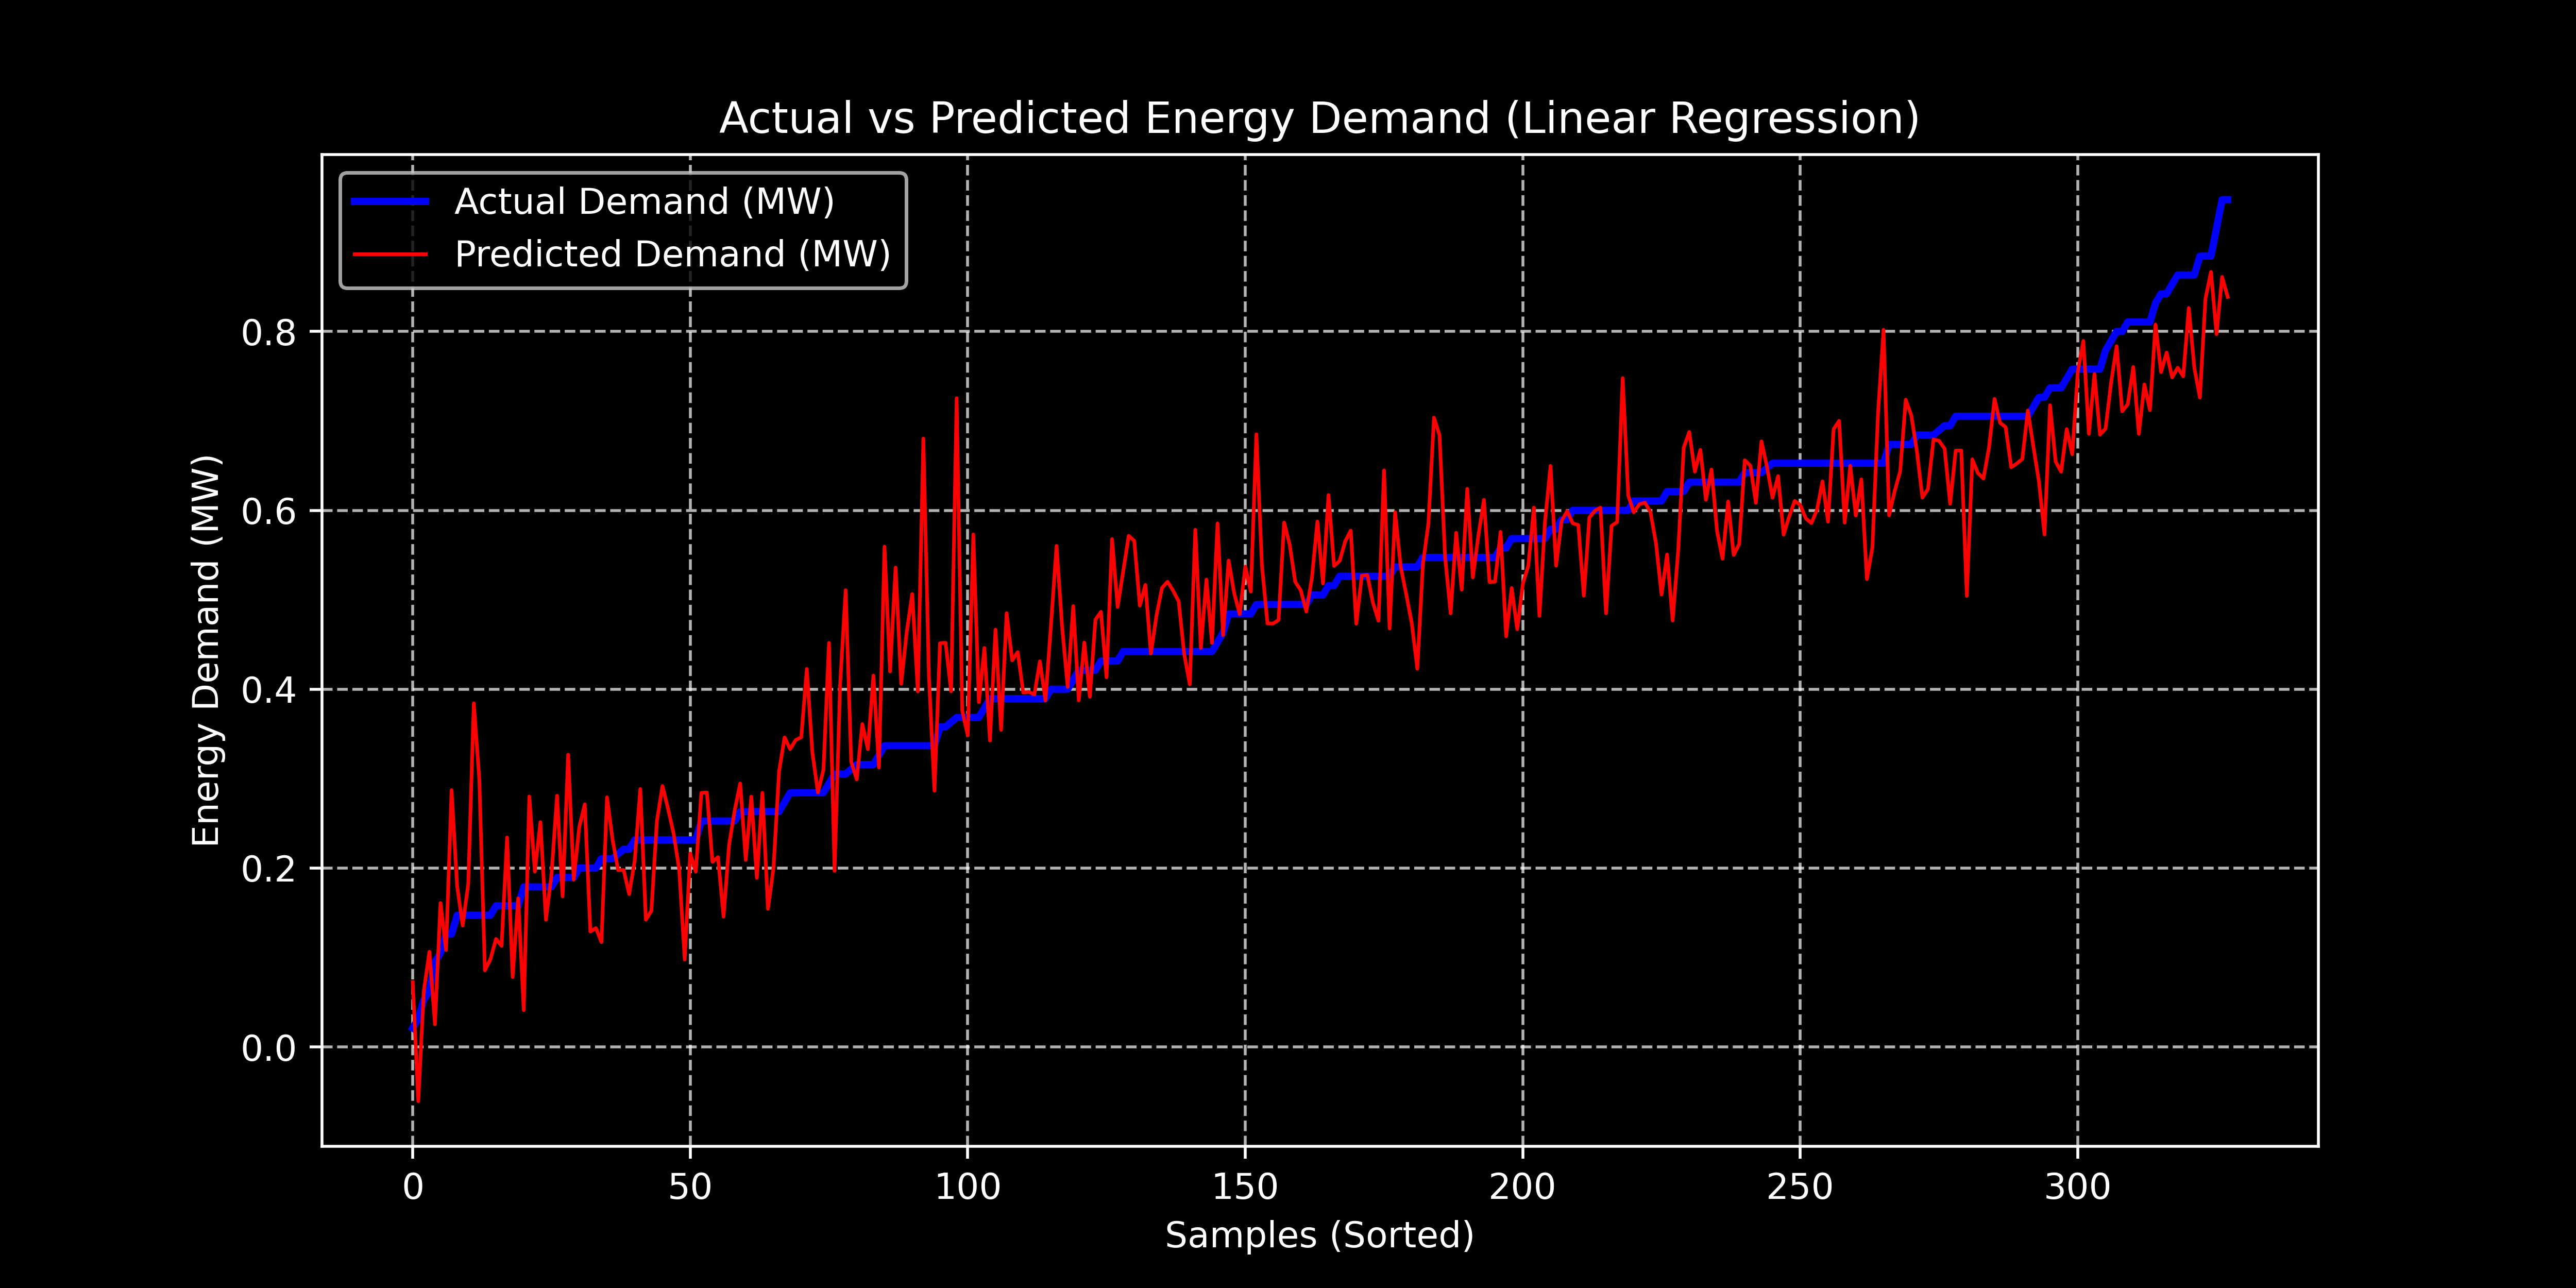
Linear Regression Prediction
Baseline comparison showing actual vs. predicted demand for Linear Regression. R2 score was lower (~0.85).